


Magnora ASA stock analysis
Magnora ASA (SVMRF) Stock Price & Analysis
SVMRF Stock Chart & Stats
- Day’s Range
- $2.80 - $3.15
- 52-Week Range
- $1.70 - $3.80
- Previous Close
- $2.98
- Volume
- N/A
- Average Volume (3M)
- 0
- Market Cap
- $149.97M
- Enterprise Value
- $1.09B
- Total Cash (Recent Filing)
- $257.00M
- Total Debt (Recent Filing)
- $46.20M
- Price to Earnings (P/E)
- ―
- Beta
- 0.14
- Next Earnings
- Feb 16, 2027 (Est.)
- EPS Estimate
- 0.01
- Last Dividend Ex-Date
- Jul 22, 2025
- Dividend Yield
- N/A
Magnora ASA News






SVMRF FAQ
What was Magnora ASA’s price range in the past 12 months?
What is Magnora ASA’s market cap?
When is Magnora ASA’s upcoming earnings report date?
How were Magnora ASA’s earnings last quarter?
Is Magnora ASA overvalued?
Does Magnora ASA pay dividends?
What is Magnora ASA’s EPS estimate?
How many shares outstanding does Magnora ASA have?
What happened to Magnora ASA’s price movement after its last earnings report?
Which hedge fund is a major shareholder of Magnora ASA?
What is the TipRanks Smart Score and how is it calculated?
Company Description
Magnora ASA
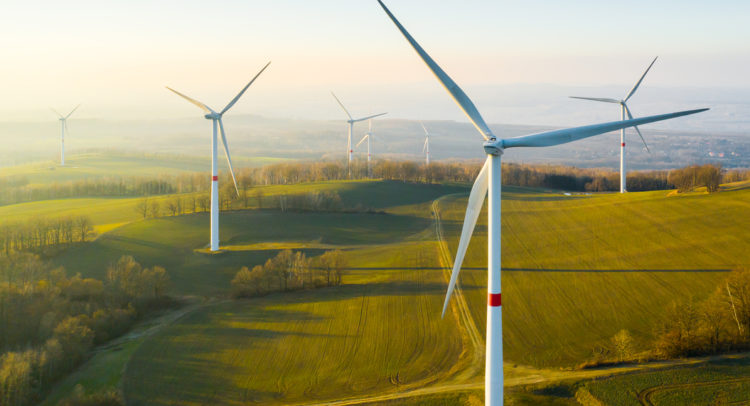
Magnora ASA operates as a renewable energy development company in Norway, Sweden, South Africa and the United Kingdom. The company focuses on developing data centers, solar photovoltaic energy, wind energy – onshore and offshore, renewable energy, and battery energy storage systems projects. The company was formerly known as Sevan Marine ASA and changed its name to Magnora ASA in October 2018. Magnora ASA was incorporated in 2001 and is based in Oslo, Norway.
- Sector
- Utilities
- Industry
- Regulated Electric
- CEO
- Erik D. Sneve
- Employees
- 43
- Website
- www.magnoraasa.com
- Address
- Karenslyst Alle 6, Oslo, PS, 0278, NO
Magnora ASA (SVMRF) Earnings & Revenues
SVMRF Company Deck
SVMRF Earnings Call
Earnings Call SentimentPositive
The earnings call reflects a positive outlook based on significant returns from strategic investments, substantial capital returns, and ongoing portfolio expansion. Despite some operational challenges, such as negative cash flow from operating activities, the company’s strategic initiatives, strong market positioning, and partnerships indicate robust growth potential.
View all SVMRF earnings summariesSVMRF Stock 12 Month Forecast
Average Price Target
Technical Analysis
Overall Consensus
| Indicator | Bullish | Neutral | Bearish |
|---|---|---|---|
| Overall Consensus | 7 | 4 | 9 |
| Technical Analysis | 2 | 4 | 2 |
| Moving Averages | 5 | 0 | 7 |
