

WSP Global (WSPN) Q3 2026 Earnings Report
MX:WSPN Q3 2026 EPS Results
- Actual EPS
- MXN 42.56
- Consensus EPS
- MXN 42.54
- Beat/Miss
- Beat by +MXN 0.01
- One Year Ago EPS
- MXN 37.50
MX:WSPN Q3 2026 Revenue Results
- Actual Revenue
- MXN 70.30B
- Expected Revenue
- MXN 56.08B
- Beat/Miss
- Beat by +MXN 14.22B
- YoY Revenue Growth
- +16.59%
Earnings Announcement Details
- Quarter
- Q3 2026
- Date
- 11/04/2026
- Time
- After Close
- Conference Call
- Wednesday, November 4, 2026
WSP Global's next earnings date is estimated for March 3, 2027, based on past reporting schedules.
Q3 2026 Earnings Call Audio
No earnings call audio is available for this earnings event.
Q3 2026 Earnings Slide Deck
Q3 2026 Earnings Call Summary
The call was strongly positive overall. WSP reported broad-based organic growth, record backlog, margin expansion, higher earnings, solid free cash flow and continued momentum in Power & Energy, Canada and EMEA. The main challenges were slower U.S. project conversion, New Zealand softness, lower APAC margins, Middle East award-timing caution, leverage above target and the decision to defer 2027 guidance, but management characterized U.S. delays as primarily timing-related and maintained confidence in the long-term opportunity.
For 2026, the financial outlook is reiterated except for net revenue, narrowed to between $16.3 billion and $16.65 billion, and adjusted EBITDA, narrowed to between $3.11 billion and $3.15 billion; for Q4 '26, net revenue is expected to range from $4.1 billion to $4.45 billion and adjusted EBITDA to range from $810 million to $850 million. The outlook assumes low single-digit organic growth in net revenue for the Americas reportable segment and upgraded mid- to high single-digit organic growth for EMEA; contribution from emergency response services in the Americas is expected to be below the historical average in the fourth quarter, and reduced public investment in New Zealand is expected to continue to temper activity level. Management is not providing 2027 guidance today and expects a gradual rather than immediate improvement in U.S. project conversion, with formal 2027 outlook to be provided with year-end results; the outlook assumes foreign exchange rates, inflation, interest rate and effective income tax rate will remain consistent throughout Q4 2026.
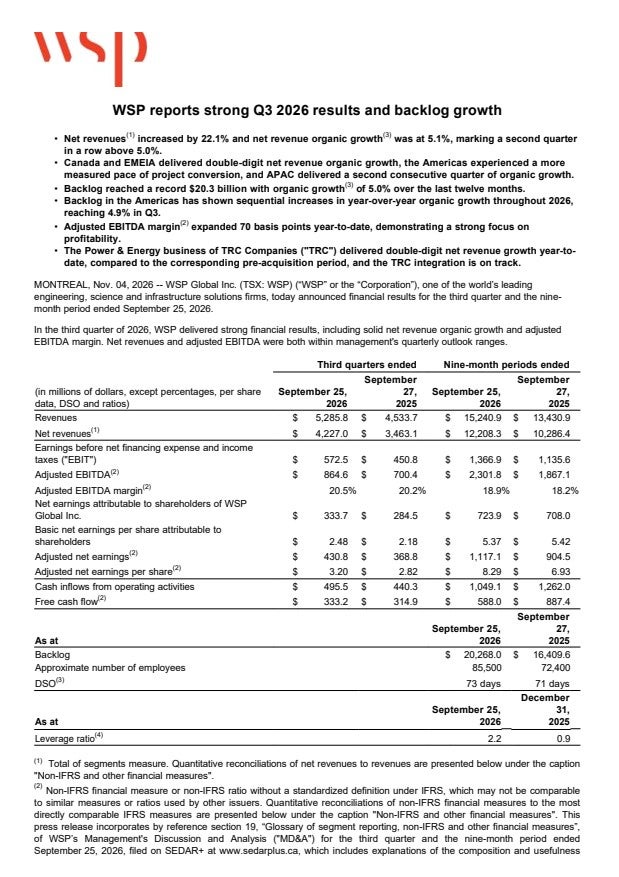
- Broad-Based Q3 GrowthNet revenue increased 22% year-over-year to $4.23 billion, including 5.1% organic growth, with all reportable segments contributing. Reported revenues increased 16.6% year-over-year to $5.3 billion, while acquisition growth was 15%, mainly attributable to TRC and Ricardo.
- Strong Regional Organic GrowthCanada delivered 10.2% organic growth, EMEA delivered 10.5% organic growth, the U.K. achieved its fifth consecutive quarter of double-digit organic growth, and APAC delivered organic growth for the second consecutive quarter. Canada and the U.K. led overall performance.
- Record BacklogBacklog reached a record $20.3 billion at the end of September, up almost 24% over the last 12 months and representing 11.6 months of revenue. Organic backlog growth was at or above 5% for the second consecutive quarter, led by the U.S., U.K. and Australia.
- Improving Americas BacklogAmericas year-over-year organic backlog growth improved sequentially from negative 1.4% in Q1 to 2.1% in Q2 and 4.9% in Q3. The U.S. backlog was approximately $11 billion, up 5% organically year-over-year, with more than 12 months of revenue cover.
- Margin Expansion and Profit GrowthAdjusted EBITDA increased 23.4% year-over-year to $865 million, compared with $700 million in Q3 2025. Adjusted EBITDA margin expanded 30 basis points to 20.5%, mainly driven by strong margins in the U.S. and Canada. Year-to-date adjusted EBITDA grew 23.3% to $2.3 billion, while margin expanded 70 basis points to 18.9%.
- Higher Adjusted and Reported EarningsAdjusted net earnings reached $431 million, or $3.22 per share, up $62 million, or $0.38 per share, from Q3 2025, mainly due to higher adjusted EBITDA. Net earnings attributable to shareholders were $334 million, or $2.48 per share, compared with $285 million, or $2.18 per share, last year.
- Solid Cash GenerationQuarterly cash inflows from operating activities increased to $496 million from $440 million, and free cash flow rose to $333 million from $315 million in Q3 2025. Nine-month free cash flow was $588 million, while trailing 12-month free cash flow was $1.41 billion, representing 1.4x net earnings attributable to shareholders.
- Power and Energy Platform ScalingTRC's Power & Energy market sector delivered double-digit net revenue growth in the first nine months of 2026, while POWER Engineers and TRC were growing at a double-digit pace year-to-date. Integration was progressing as planned, with more than 100 joint pursuits underway.
- Strategic U.S. Power WinWSP was selected by American Electric Power as a delivery partner for its Western regulated transmission portfolio. Management described this as an important strategic win and an example of the long-duration client relationships the expanded Power & Energy platform can capture.
- Strong Canadian Position and DemandWSP remained involved in 68 of Canada's 100 largest public-sector infrastructure projects, more than any company in the industry. Demand was described as healthy across transportation, defense, data centers, water, aviation, energy and municipal infrastructure, with additional opportunity from the federal push to accelerate nation-building projects.
- EMEA MomentumEMEA backlog grew almost 12% organically over the last 12 months. The U.K. was supported by Transport & Infrastructure, Power & Energy and data centers, with further expansion in defense and nuclear. Central Europe had selective strength in data centers, industry, energy and defense.
- Middle East Project WinsTransportation & Infrastructure and Property & Buildings in the Middle East both delivered double-digit organic growth in the quarter. WSP secured work with key clients, including the modernization of King Fahd International Airport in Dammam.
- Australia Growth and Capability ExpansionAustralia had healthy momentum supported by Property & Buildings and major transport programs. The acquisition of e2m expanded WSP's ecology and approvals capabilities.
- Acquisition and M&A ActivityWSP completed three acquisitions during the quarter and continued formal and informal discussions regarding additional opportunities. Recent acquisitions included GCM Corpo in Canada, Hulley & Kirkwood in the U.K. and e2m in Australia. Management said valuations remained relatively constant and that M&A remained part of the company's strategy.
- Expanded Canadian Energy CapabilitiesThe acquisition of GCM Corpo added approximately 600 people, strengthened Canadian power and energy and process-engineering capabilities, and provided access to blue-chip clients in oil and gas, mining and other power-related sectors.
- Variable Cost Structure and Operational FlexibilityManagement said less than 10%, or approximately 7% to 8%, of costs are fixed, allowing the company to be nimble. The U.S. Transport & Infrastructure workforce was maintained at the same size as on January 1 while the company managed slower project starts.
- Strong U.S. Profitability and Win RateWSP reported a 22.5% margin in its U.S. business. Management also stated that the U.S. win rate was increasing and characterized this as evidence that WSP was gaining market share.
- Long-Term Growth PrioritiesManagement reaffirmed growth priorities including program and project management, water, defense and Power & Energy. Defense expansion was cited in Australia, the U.K., Central Europe and Canada, while management said Power & Energy remained an area for further growth outside the U.S.
- 2026 Outlook Reaffirmed Within Narrowed RangesThe 2026 outlook was reiterated, with net revenue narrowed to $16.3 billion to $16.65 billion and adjusted EBITDA narrowed to $3.11 billion to $3.15 billion. Q4 net revenue was expected to range from $4.1 billion to $4.45 billion and adjusted EBITDA from $810 million to $850 million.
MX:WSPN Earnings History
| Report Date | Fiscal Quarter | Forecast / EPS | Last Year's EPS | EPS YoY Change | Press Release |
|---|---|---|---|---|---|
| Mar 03, 2027 | 2026 (Q4) | 41.00- | 35.24 | ― | ― |
| Nov 04, 2026 | 2026 (Q3) | 42.5442.56 | 37.5 | 13.48% (+5.05) | |
| Aug 05, 2026 | 2026 (Q2) | 37.6038.30 | 31.25 | 22.55% (+7.05) | |
| May 06, 2026 | 2026 (Q1) | 27.4029.39 | 23.41 | 25.57% (+5.98) | |
| Feb 25, 2026 | 2025 (Q4) | 34.8635.24 | 31.12 | 13.25% (+4.12) | |
| Nov 05, 2025 | 2025 (Q3) | 35.1637.50 | 29.79 | 25.89% (+7.71) | |
| Aug 06, 2025 | 2025 (Q2) | 30.1831.25 | 25.14 | 24.34% (+6.12) | |
| May 07, 2025 | 2025 (Q1) | 22.9023.41 | 20.61 | 13.55% (+2.79) | |
| Feb 26, 2025 | 2024 (Q4) | 30.2331.12 | 26.47 | 17.59% (+4.65) | |
| Nov 06, 2024 | 2024 (Q3) | 29.8229.79 | 26.33 | 13.13% (+3.46) |
The table shows recent earnings report dates and whether the forecast was beat or missed. See the change in forecast and EPS from the previous year.
