


Power Corp of Canada earnings date
Power Corp of Canada (POWN) Q3 2026 Earnings Report
MX:POWN Q3 2026 EPS Results
- Actual EPS
- MXN 19.96
- Consensus EPS
- MXN 21.03
- Beat/Miss
- Missed by -MXN 1.07
- One Year Ago EPS
- MXN 17.62
MX:POWN Q3 2026 Revenue Results
- Actual Revenue
- MXN 125.57B
- Expected Revenue
- MXN 62.65B
- Beat/Miss
- Beat by +MXN 62.92B
- YoY Revenue Growth
- -40.97%
Earnings Announcement Details
- Quarter
- Q3 2026
- Date
- 11/11/2026
- Time
- After Close
- Conference Call
- Wednesday, November 11, 2026
Power Corp of Canada's next earnings date is estimated for March 24, 2027, based on past reporting schedules.
Q3 2026 Earnings Call Audio
No earnings call audio is available for this earnings event.
Q3 2026 Earnings Slide Deck
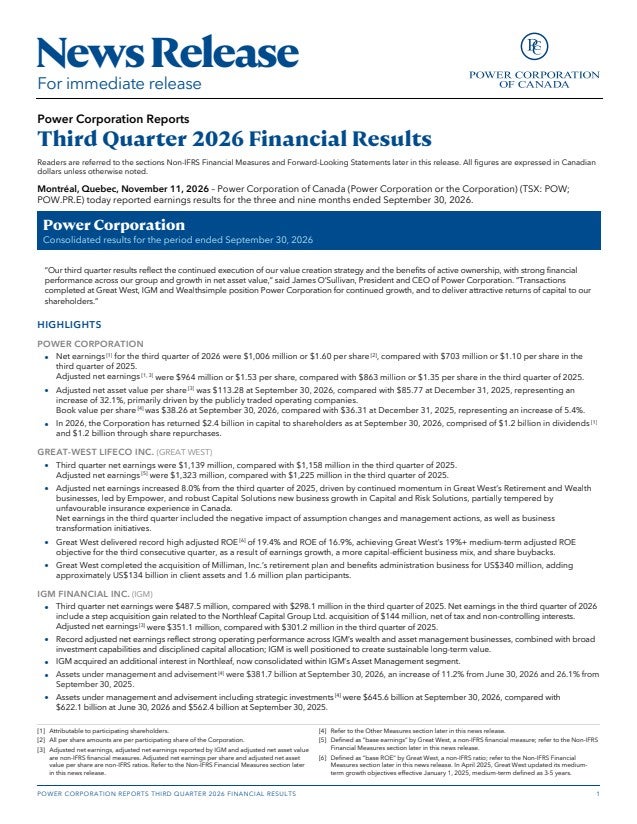
Q3 2026 Earnings Call Summary
The call was strongly constructive, with broad-based earnings growth at Great-West and IGM, record or rising operating metrics, substantial NAV appreciation, strong cash availability and significant shareholder returns. The main challenges were losses and earnings volatility in certain NAV-based and alternative businesses, a 5% decline in ChinaAMC assets, higher corporate expenses and a still-material NAV discount. Highlights significantly outweighed the lowlights.
Management said Great-West and IGM are exceeding their respective adjusted EPS growth targets that should generate low to mid-teen returns, inclusive of the dividend yield; Great-West intends to buy back another $1.6 billion of stock next year, while Power’s intention to proportionately participate has not changed. Sagard has a crystal clear goal of USD 100 billion in assets over the next several years, and management expects progress on sustainable FRE and growing margin in 2027, while noting FRE will not be positive in every single quarter but should directionally grow over time; Power Sustainable expects to have more to report as it moves through 2027. GBL has a 12-month target to return about EUR 1 billion through buybacks and dividends, and Power’s proprietary investments target a 10% return, having been in excess of 10% over the past 1, 3 and 5 years. For Power buybacks, management said to start with the base plan of what has been done in recent years, which has moved around from a couple of hundred million up to $400 million, and then take guidance from the Great-West program.
- Adjusted Earnings and EPS GrowthPower's Q3 adjusted net earnings were $964 million, up 12% year-over-year, while adjusted EPS was $1.53, up 13% compared with Q3 last year. Results reflected strong business momentum from Great-West and IGM.
- Strong Great-West PerformanceGreat-West contributed $905 million to Power's adjusted net earnings, up 7% year-over-year. Great-West reported base EPS of $1.48, up 11%, and achieved a record-high base ROE of 19.4%, exceeding its 19-plus percent medium-term objective for the third straight quarter.
- Empower Earnings and Operating MomentumEmpower's base earnings grew 15% year-over-year on a constant-currency basis. Retirement Services client assets reached $2.15 trillion, with base earnings also up 15%, while Empower Wealth base earnings increased 28% and its pretax base operating margin rose 410 basis points.
- IGM Record QuarterIGM reported a record quarter with adjusted EPS of $1.51, up 19% year-over-year and ahead of its 9%-plus medium-term target. The result was particularly supported by strong performance in Wealth Management.
- IGM Wealth Management and Asset GrowthIGM's Wealth Management business grew 30% year-over-year, with AUM&A of $178 billion, up 14%. IGM reported a record third quarter of new client gross inflows. Net flows across IG Wealth and Mackenzie, including Northleaf, were $3.4 billion, while AUM&A including strategic investments reached $645.6 billion, up 15% year-over-year.
- IGM Capital Returns and Strategic InvestmentsIGM returned over $1 billion to shareholders year-to-date through $585 million in share repurchases and $421 million in dividends. IGM increased its interest in Northleaf to approximately 61%, with results now consolidated in Asset Management, and its Wealthsimple ownership is valued at $2.9 billion.
- Investment Fund Net Sales GrowthIGM investment fund net sales were $664 million, up from $407 million in Q3 last year.
- Growth at Rockefeller and NorthleafRockefeller's client assets grew 27% year-over-year to $236.5 billion, while Northleaf's client assets increased 10% to just under $38 billion.
- Wealthsimple Valuation and Client MomentumWealthsimple's assets under administration increased to $170 billion from $155 billion last quarter, supported by approximately $11 billion of net flows. Wealthsimple added 200,000 clients during the quarter and now serves approximately 4 million Canadians. Its financing round was for up to $425 million, including a $300 million primary offering, and Power's collective group interest was valued at $5 billion net of carry, up 13% quarter-over-quarter.
- Strong NAV Growth and Cash PositionPower's NAV per share was $113.28 at the end of Q3, up 57% year-over-year, and was $120.20 as of the prior night's close. Cash and cash equivalents were $1.9 billion at quarter-end, including $1.6 billion available after netting dividends to be received and paid. Ninety percent of gross asset value was related to public companies, rising to 93% when cash was included.
- Significant Shareholder ReturnsPower returned $2.4 billion to shareholders through dividends and share buybacks during the first nine months of the year, ahead of $1.5 billion in the same period last year. Since 2020, the company has returned just over $13 billion through dividends and share repurchases.
- Great-West Capital Return and Financial FlexibilityGreat-West's year-to-date share repurchases were nearly $1.3 billion. Its cash balance was $2.8 billion net of a planned EUR 500 million bond repayment in Q4, providing flexibility to deploy capital into organic and inorganic strategies. Power stated that its intention to participate proportionately in Great-West's announced additional $1.6 billion buyback next year has not changed.
- GBL Portfolio Simplification and Capital ReturnsGBL has completed more than EUR 5 billion of disposals across listed companies and noncore assets, is expected to deploy EUR 2.4 billion in 2026 across direct private assets through controlled or co-controlled positions, and returned EUR 888 million through buybacks and dividends year-to-date. GBL has a 12-month target to return approximately EUR 1 billion to shareholders and does not need to sell assets for liquidity.
- Alternative Platforms ScalingPower's alternative asset management platforms reported total AUM of $71.4 billion at quarter-end. Sagard raised approximately CAD 1.4 billion during the quarter and nearly CAD 4 billion year-to-date despite challenging market conditions, and acquired an additional 20% economic interest in HalseyPoint, bringing its ownership to 60%.
- Power Sustainable Investment PlansPower Sustainable announced plans to invest and mobilize more than $10 billion in Canadian projects and companies over the next five years. Its energy infrastructure and infrastructure credit funds are progressing toward second fund closings; infrastructure credit completed three new financings, while energy infrastructure completed capital recycling through a wind project sale and advanced renewable energy and storage opportunities across North America.
- Active Ownership and AI InitiativeManagement described active ownership across strategy, capital allocation, key people decisions and risk as a core value-creation approach. Power is specifically leaning into artificial intelligence to help its operating companies win in AI over the next several years, similar to its prior focus on fintech and digitalization.
- Proprietary Investment ReturnsManagement stated that returns on proprietary investments and co-investments behind the alternative platforms have been in excess of 10% over the past 1-, 3- and 5-year periods.
- NAV Discount Narrowing and Long-Term ReturnsPower's NAV discount narrowed during the quarter to roughly 20%. Management stated that NAV has grown at a 19% compound annual growth rate since 2020 and that total shareholder returns have materially outperformed the S&P/TSX Financials Index and the broader S&P/TSX Composite over the 1-, 3-, 5-, 10- and 30-year periods.
- Forward Growth FrameworkManagement said Great-West and IGM are exceeding their adjusted EPS growth targets, which should generate low to mid-teen returns inclusive of dividend yield. The company also expects continued growth from Wealthsimple, scaling at Sagard and Power Sustainable, and shareholder distributions across Great-West, IGM and GBL.
MX:POWN Earnings History
| Report Date | Fiscal Quarter | Forecast / EPS | Last Year's EPS | EPS YoY Change | Press Release |
|---|---|---|---|---|---|
| Mar 24, 2027 | 2026 (Q4) | 21.11- | 17.75 | ― | ― |
| Nov 11, 2026 | 2026 (Q3) | 21.0319.96 | 17.62 | 13.33% (+2.35) | |
| Jul 30, 2026 | 2026 (Q2) | 20.2520.23 | 18.01 | 12.32% (+2.22) | |
| May 12, 2026 | 2026 (Q1) | 18.6718.66 | 15.92 | 17.21% (+2.74) | |
| Mar 18, 2026 | 2025 (Q4) | 18.7417.75 | 16.7 | 6.25% (+1.04) | |
| Nov 12, 2025 | 2025 (Q3) | 17.4217.62 | 10.96 | 60.71% (+6.65) | |
| Aug 07, 2025 | 2025 (Q2) | 16.7918.01 | 15.27 | 17.95% (+2.74) | |
| May 13, 2025 | 2025 (Q1) | 16.4215.92 | 14.61 | 8.93% (+1.30) | |
| Mar 19, 2025 | 2024 (Q4) | 18.1416.70 | 11.61 | 43.82% (+5.09) | |
| Nov 12, 2024 | 2024 (Q3) | 14.8610.96 | 19.83 | -44.74% (-8.87) |
The table shows recent earnings report dates and whether the forecast was beat or missed. See the change in forecast and EPS from the previous year.
