


iA Financial Corporation Inc earnings date
iA Financial Corporation Inc (IAG1N) Q3 2026 Earnings Report
MX:IAG1N Q3 2026 EPS Results
- Actual EPS
- MXN 52.55
- Consensus EPS
- MXN 49.18
- Beat/Miss
- Beat by +MXN 3.36
- One Year Ago EPS
- MXN 45.24
MX:IAG1N Q3 2026 Revenue Results
- Actual Revenue
- MXN 39.13B
- Expected Revenue
- ―
- Beat/Miss
- ―
- YoY Revenue Growth
- -14.01%
Earnings Announcement Details
- Quarter
- Q3 2026
- Date
- 11/09/2026
- Time
- After Close
- Conference Call
- Monday, November 9, 2026
iA Financial Corporation Inc's next earnings date is estimated for February 16, 2027, based on past reporting schedules.
Q3 2026 Earnings Call Audio
No earnings call audio is available for this earnings event.
Q3 2026 Earnings Slide Deck
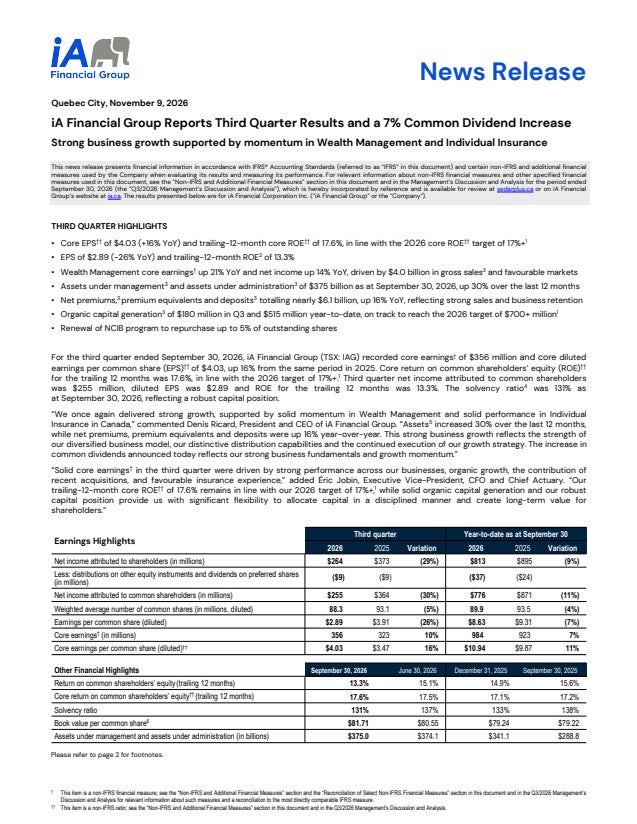
Q3 2026 Earnings Call Summary
The call was strongly positive overall. The company reported broad-based revenue and earnings growth, strong wealth-management momentum, robust capital generation, progress toward or achievement of financial targets, acquisition accretion and increased shareholder returns. The main challenges were emerging U.S. lapse and business-quality pressure, slower U.S. Dealer Services pipeline development, investment-segment year-over-year earnings pressure and some higher corporate expenses, but management described the U.S. outlook as positive and the year-end assumption outlook as neutral to slightly positive.
Management reaffirmed its midterm objective of core EPS growth of 10% or more on an annual average basis, a 2026 core ROE target of 17% or more, 2026 organic capital generation of more than $700 million, and a core dividend payout ratio target range of 25% to 35%; corporate core other expenses are targeted at $70 million, plus or minus $5 million, quarterly. In the U.S., management said it probably will not see the 20% growth seen as of late but is very comfortable with 10% growth, while the outlook remains very positive; RF Capital remains on track to deliver core EPS accretion of at least $0.15 per share in 2026, seg. fund savings growth was indicated at 8% to 10%, and year-end assumption changes are expected to be neutral to slightly positive overall.
- Strong Quarterly Earnings and Return on EquityThird-quarter core EPS reached $4.03, up 16% year-over-year. Trailing 12-month core ROE increased to 17.6%, while quarterly annualized core ROE was 20%.
- Broad-Based Business GrowthNet premium, premium equivalent and deposits reached $6.1 billion, up 16% year-over-year, while assets under management and administration reached $375 billion, up 30% over the last 12 months.
- Robust Capital Position and Shareholder ReturnsThe company ended the quarter with a 131% solvency ratio, $0.9 billion of capital available for deployment and $180 million of organic capital generation during the quarter. It returned $189 million through share buybacks and increased the quarterly dividend by 7% to $1.18 per share.
- Book Value GrowthBook value per common share reached $81.71, up 3% over the last 12 months.
- Insurance Canada GrowthIndividual Insurance sales increased 13% year-over-year to $115 million, and iA maintained its number-one position in Canada for policies issued. Dealer Services sales reached $216 million, up 1%, while iA Auto and Home sales reached $186 million, up 3%, supported by higher policy volumes and pricing adjustments.
- Insurance Canada ProfitabilityInsurance Canada core earnings increased 19% year-over-year to $135 million. Results benefited from $35 million of insurance experience gains versus a $2 million loss last year, mainly reflecting favorable mortality and lower iA Auto and Home claims due to favorable weather.
- Wealth Management MomentumIndividual gross sales reached $3.2 billion and individual net fund inflows approached $1.3 billion. Segregated-fund gross sales increased 36% year-over-year to more than $2.2 billion, net sales exceeded $1.3 billion, and segregated-fund assets under management surpassed $50 billion.
- Leadership in Segregated FundsThe company maintained its number-one position in Canada for segregated-fund gross sales, net sales and assets under management. Management cited strong distribution reach, competitive products and digital tools as contributors to the momentum.
- Additional Wealth Management GrowthMutual-fund gross sales reached $571 million, sales of other individual savings products increased 14% to $455 million, and Group Savings and Retirement sales reached $745 million, up 23% year-over-year. Assets under management in Group Savings and Retirement increased 9% over the last 12 months.
- Wealth Management Earnings and Acquisition ContributionWealth Management core earnings increased 21% year-over-year to $151 million. RF Capital made a strong contribution and remained on track to deliver core EPS accretion of at least $0.15 per share in 2026.
- U.S. Individual Insurance GrowthU.S. Individual Insurance sales reached $97 million, up 24% year-over-year, driven by the final expense and middle-market segments. The combined contribution from Fidelity Life and eFinancial was accretive to core EPS during the quarter as expected.
- U.S. Dealer Services GrowthU.S. Dealer Services sales increased 4% year-over-year to $298 million, reflecting the strength and diversity of the distribution channels and product offering.
- Progress Toward Financial TargetsCore EPS grew 11% year-over-year for the first nine months of 2026, in line with the midterm objective of 10% or more on an annual average basis. Trailing 12-month core ROE of 17.6% met the 2026 target of 17% or more. Year-to-date organic capital generation was $515 million, with the company remaining on track to exceed $700 million for 2026, and the year-to-date core dividend payout ratio was 29.2%, within the 25% to 35% target range.
- Solid Underlying Earnings DriversThird-quarter core earnings were $356 million. Expected insurance earnings increased 9% year-over-year, while core noninsurance activities increased 13%, driven by wealth distribution and advisory affiliates, including RF Capital.
- U.S. Segment ProfitabilityU.S. operations core earnings increased 16% year-over-year to $37 million. Expected insurance earnings increased 11% year-over-year, and the segment recorded a $5 million net insurance experience gain.
- Continued Investment in Growth CapabilitiesThe company stated that it will continue investing in distribution, technology and products, including ongoing investment in AI, digital capabilities and technology infrastructure, while maintaining expense, capital-allocation and business-quality discipline.
- Positive Outlook for Segregated-Fund GrowthManagement reiterated its positive view of continued segregated-fund growth and referenced an Investor Day outlook of 8% to 10% growth in savings.
- Positive Investment Performance in Private AssetsManagement stated that private equity and infrastructure investments had tended to outperform over the quarter and over the last several years, reflecting the team's effectiveness in finding good deals.
- Favorable Year-End Assumption OutlookManagement said it did not expect anything materially negative from the year-end assumption review and expected the overall impact to be neutral to slightly positive, while continuing to monitor U.S. lapse trends.
MX:IAG1N Earnings History
| Report Date | Fiscal Quarter | Forecast / EPS | Last Year's EPS | EPS YoY Change | Press Release |
|---|---|---|---|---|---|
| Feb 16, 2027 | 2026 (Q4) | 48.20- | 40.42 | ― | ― |
| Nov 09, 2026 | 2026 (Q3) | 49.1852.55 | 45.24 | 16.14% (+7.30) | |
| Aug 04, 2026 | 2026 (Q2) | 44.4247.98 | 45.5 | 5.44% (+2.48) | |
| May 05, 2026 | 2026 (Q1) | 42.6042.38 | 37.94 | 11.68% (+4.43) | |
| Feb 17, 2026 | 2025 (Q4) | 42.9140.42 | 39.64 | 1.97% (+0.78) | |
| Nov 04, 2025 | 2025 (Q3) | 43.5145.24 | 38.2 | 18.43% (+7.04) | |
| Aug 05, 2025 | 2025 (Q2) | 39.6045.50 | 35.86 | 26.91% (+9.65) | |
| May 07, 2025 | 2025 (Q1) | 37.1537.94 | 31.81 | 19.26% (+6.13) | |
| Feb 18, 2025 | 2024 (Q4) | 36.4839.64 | 30.51 | 29.91% (+9.13) | |
| Nov 05, 2024 | 2024 (Q3) | 34.1038.20 | 32.6 | 17.20% (+5.61) |
The table shows recent earnings report dates and whether the forecast was beat or missed. See the change in forecast and EPS from the previous year.
