


Nitto Kohki Co., Ltd. AI Stock Analysis
Want to see JP:6151 full AI Analyst Report?
Nitto Kohki Co., Ltd. (6151) AI Stock Analysis
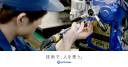
Nitto Kohki Co., Ltd.
(TSE/TYO:6151)
Nitto Kohki scores below average, weighed down primarily by deteriorating operating performance: EBIT margins have fallen roughly two-thirds in three years, revenue is flat, and free cash flow has been negative for three straight years amid heavy capital spending. Technicals compound the concern, with the price trading beneath all major moving averages and negative MACD momentum. Offsetting these risks are an exceptionally conservative, near debt-free balance sheet that removes any solvency concern, and an inexpensive valuation at under 11x earnings with a 2.5% dividend yield. The stock is financially safe but operationally challenged — a re-rating likely requires evidence that recent capital investment converts into revenue growth and margin recovery.
Nitto Kohki Co., Ltd. (6151) vs. iShares MSCI Japan ETF (EWJ)
- Market Cap
- JPY 26.82B
- Dividend Yield
- 2.48%
- Average Volume (3M)
- 23.08K
- Price to Earnings (P/E)
- 10.6
- Beta (1Y)
- 0.88
- Revenue Growth
- 5.95%
- EPS Growth
- 392.59%
- Country
- Japan
- Employees
- 1,032
- Sector
- Industrials
- Sector Strength
- 63
- Industry
- Industrial - Machinery
Nitto Kohki Co., Ltd. Business Overview & Revenue Model
Company Description
Nitto Kohki Co., Ltd., established in Tokyo, Japan, in 1956, is a global developer and manufacturer of diverse industrial components. The company specializes in producing advanced fluid couplings, labor-saving machine tools, and a variety of pumps, i...
How the Company Makes Money
Nitto Kohki primarily makes money by manufacturing and selling industrial products to business customers through domestic and overseas sales channels. Key revenue streams include: (1) Sales of quick-connect couplings and related connection components...
Nitto Kohki Co., Ltd. Financial Statement Overview
Summary
A debt-free, fortress-like balance sheet (debt-to-equity under 3.2%, steadily growing equity near ¥61 billion) is the company's standout strength and scores well at 82. However, this is heavily offset by a weak income statement (38) and poor cash flow (35). Operating margins have collapsed from 13.7% to a projected 4.3%, gross margins continue to compress, and revenue has been essentially flat around ¥27 billion. Free cash flow has been negative for three consecutive years, driven by elevated capex, while return on equity of just 2–4% points to inefficient deployment of a large asset base. The blended picture is one of financial safety without operational momentum.
Income Statement
38NegativeBalance Sheet
82Very PositiveCash Flow
35Negative| Breakdown | TTM | Mar 2026 | Mar 2025 | Mar 2024 | Mar 2023 | Mar 2022 |
|---|---|---|---|---|---|---|
Income Statement | ||||||
| Total Revenue | 27.80B | 27.29B | 27.26B | 27.07B | 28.09B | 25.28B |
| Gross Profit | 11.44B | 11.46B | 12.14B | 12.32B | 12.88B | 11.79B |
| EBITDA | 3.28B | 3.15B | 3.67B | 4.00B | 5.20B | 4.43B |
| Net Income | 2.78B | 2.15B | 1.35B | 1.84B | 2.49B | 1.86B |
Balance Sheet | ||||||
| Total Assets | 68.62B | 68.67B | 67.57B | 65.99B | 67.26B | 64.79B |
| Cash, Cash Equivalents and Short-Term Investments | 15.49B | 16.22B | 20.30B | 25.16B | 31.82B | 31.80B |
| Total Debt | 1.48B | 1.54B | 1.59B | 1.63B | 1.75B | 1.74B |
| Total Liabilities | 7.46B | 7.72B | 9.38B | 8.82B | 9.49B | 9.12B |
| Stockholders Equity | 61.14B | 60.93B | 58.17B | 57.16B | 57.76B | 55.66B |
Cash Flow | ||||||
| Free Cash Flow | 0 | -2.13B | -2.08B | -3.61B | 1.24B | 1.73B |
| Operating Cash Flow | 0 | 4.17B | 2.71B | 2.31B | 2.30B | 2.95B |
| Investing Cash Flow | 0 | -4.80B | -6.85B | -333.00M | 4.65B | 3.64B |
| Financing Cash Flow | 0 | -1.04B | -1.39B | -3.74B | -1.50B | -1.15B |
Nitto Kohki Co., Ltd. Technical Analysis
Price Trends
Market Momentum
Evaluating momentum and price trends is crucial in stock analysis to make informed investment decisions. For JP:6151, the sentiment is Negative. The current price of 1450.00 is below the 20-day moving average (MA) of 1552.75, below the 50-day MA of 1639.64, and below the 200-day MA of 1680.26, indicating a bearish trend. The MACD of -49.77 indicates Positive momentum. The RSI at 32.16 is Neutral, neither overbought nor oversold. The STOCH value of 8.07 is Positive, not indicating any strong overbought or oversold conditions. Overall, these indicators collectively point to a Negative sentiment for JP:6151.
Nitto Kohki Co., Ltd. Peers Comparison
Overall Rating
 JP:636376Outperform
 JP:638175Outperform
 JP:651771Outperform
 JP:637665Neutral
 JP:649864Neutral
- JP:615151Neutral
Financial Indicators
| Name | Overall Rating | Market Cap | P/E Ratio | ROE | Dividend Yield | Revenue Growth | EPS Growth |
|---|---|---|---|---|---|---|---|
| JP:6363 | 76Outperform | JPY 63.85B | 5.76 | ― | 2.66% | -1.87% | 215.36% |
| JP:6381 | 75Outperform | JPY 67.10B | 11.09 | ― | 5.34% | 13.76% | 38.30% |
| JP:6517 | 71Outperform | JPY 66.85B | 10.28 | ― | 4.16% | 9.85% | 33.61% |
| JP:6376 | 65Neutral | JPY 163.62B | 9.45 | 10.86% | 1.94% | 12.76% | 63.89% |
| JP:6498 | 64Neutral | JPY 149.49B | 11.54 | 10.55% | 3.60% | 14.51% | 10.65% |
| Sector * | 63Neutral | $10.79B | 15.43 | 7.44% | 2.01% | 2.89% | -14.66% |
| JP:6151 | 51Neutral | JPY 27.14B | 10.59 | ― | 2.48% | 5.95% | 392.59% |
* Industrials Sector Average
Performance Comparison
| Show on chart | Ticker | Company Name | Price | Change | % Change |
|---|---|---|---|---|---|
| JP:6151 | Nitto Kohki Co., Ltd. | 1450.00 | -116.33 | -7.43% | |
| JP:6498 | Kitz Corporation | 1695.00 | 107.16 | 6.75% | |
| JP:6376 | Nikkiso Co., Ltd. | 2680.00 | 1182.00 | 78.90% | |
| JP:6363 | Torishima Pump Mfg.Co., Ltd. | 2480.00 | 669.87 | 37.01% | |
| JP:6381 | ANEST IWATA Corp. | 1668.00 | 215.61 | 14.85% | |
| JP:6517 | Denyo Co., Ltd. | 3365.00 | 361.48 | 12.04% |
Nitto Kohki Co., Ltd. Corporate Events
Nitto Kohki Reports Consolidated Results for Six Months Ended September 30, 2026
Nitto Kohki Co., Ltd. is listed on Tokyo Prime under securities code 6151 and issued consolidated financial results under Japanese GAAP for the six months ended September 30, 2026.Net sales rose 9.4% year on year to ¥14,411 million, while operating p...
Disclaimer
This AI Analyst Stock Report is automatically generated by our AI systems using advanced algorithms and publicly available financial, technical, and market data. While the information provided aims to be accurate and insightful, it is intended for informational purposes only and should not be considered financial advice. Any content created by an AI (Artificial Intelligence) system may contain inaccuracies and/or contain errors. Investing in stocks carries inherent risks, and past performance is not indicative of future results. This report does not account for your personal financial circumstances, objectives, or risk tolerance. Always conduct your own research or consult with a qualified financial advisor before making investment decisions. The analysis and recommendations provided are based on historical and current data and may not fully reflect future market conditions or unexpected developments. Neither the creators of this report nor its affiliated entities guarantee the accuracy, completeness, or reliability of the information presented. Use this report at your own discretion and risk.
Date of analysis: Nov 17, 2026