


Mie Kotsu Group Holdings, Inc. AI Stock Analysis
Want to see JP:3232 full AI Analyst Report?
Mie Kotsu Group Holdings, Inc. (3232) AI Stock Analysis
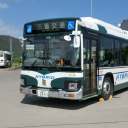
Mie Kotsu Group Holdings, Inc.
(TSE/TYO:3232)
Mie Kotsu Group Holdings earns a moderately above-average score. The most influential factor is its mixed financial profile: a strong post-pandemic earnings recovery with growing revenue and profits is offset by thin margins, elevated debt (~1.26x debt-to-equity) and persistently negative free cash flow due to capital-intensive operations. Supporting the score is an attractive valuation — an 8.8x P/E paired with a 3.64% dividend yield — and a steady technical setup, with the share price trading above all key moving averages amid neutral, non-stretched momentum. Earnings call and corporate event components were excluded for lack of data, with their weight redistributed. The key item to watch is whether the projected FY2026 growth finally translates into positive free cash flow.
Mie Kotsu Group Holdings, Inc. (3232) vs. iShares MSCI Japan ETF (EWJ)
- Market Cap
- JPY 57.84B
- Dividend Yield
- 3.64%
- Average Volume (3M)
- 251.50K
- Price to Earnings (P/E)
- 8.8
- Beta (1Y)
- 0.58
- Revenue Growth
- 10.87%
- EPS Growth
- 10.26%
- Country
- Japan
- Employees
- 3,072
- Sector
- General
- Sector Strength
- 55
- Industry
- Conglomerates
Mie Kotsu Group Holdings, Inc. Business Overview & Revenue Model
Company Description
Mie Kotsu Group Holdings, Inc. is a multifaceted Japanese company engaged in transportation, real estate, retail, and leisure services. Its transportation offerings include transit, charter, and intercity express bus lines, as well as limousine servi...
How the Company Makes Money
The company makes money primarily through its operating subsidiaries rather than at the holding-company level. Key revenue streams include: (1) Transportation and mobility services: fare revenue from passenger transportation services operated by grou...
Mie Kotsu Group Holdings, Inc. Financial Statement Overview
Summary
Mixed fundamentals. The income statement is the clear strength (score 68): revenue has recovered from ¥81.2bn in FY2021 to ¥103.8bn in FY2025 with ¥110.3bn projected for FY2026, and the company swung from a ¥1.7bn net loss to ¥6.1bn net income, with EBIT rising to ¥8.4bn. However, margins remain thin (EBIT ~8.1%, net <6%). The balance sheet is average (score 52): debt-to-equity has improved to ~1.26x from 1.80x and equity has grown to ¥62.8bn, but absolute debt of ~¥79bn remains elevated relative to earnings power, a risk as Japanese rates rise. Cash flow is the weakest link (score 45): operating cash flow is steady at ¥6.4–9.2bn, but heavy capex drives persistently negative free cash flow (-¥1.6bn in FY2025, -¥1.0bn projected FY2026), limiting flexibility for deleveraging and shareholder returns.
Income Statement
68PositiveBalance Sheet
52NeutralCash Flow
45Neutral| Breakdown | TTM | Mar 2026 | Mar 2025 | Mar 2024 | Mar 2023 | Mar 2022 |
|---|---|---|---|---|---|---|
Income Statement | ||||||
| Total Revenue | 113.82B | 110.26B | 103.85B | 98.22B | 93.12B | 84.35B |
| Gross Profit | 31.67B | 30.99B | 24.99B | 23.35B | 22.12B | 18.15B |
| EBITDA | 15.79B | 15.24B | 13.52B | 12.16B | 11.24B | 8.49B |
| Net Income | 6.57B | 6.25B | 6.06B | 4.75B | 3.77B | 2.21B |
Balance Sheet | ||||||
| Total Assets | 204.62B | 191.51B | 181.61B | 181.29B | 167.90B | 165.15B |
| Cash, Cash Equivalents and Short-Term Investments | 6.90B | 4.73B | 5.42B | 9.67B | 9.33B | 7.38B |
| Total Debt | 87.71B | 81.09B | 79.19B | 80.67B | 79.60B | 82.38B |
| Total Liabilities | 126.87B | 120.98B | 118.43B | 121.96B | 115.12B | 116.76B |
| Stockholders Equity | 77.32B | 70.14B | 62.83B | 59.01B | 52.47B | 48.10B |
Cash Flow | ||||||
| Free Cash Flow | 0 | -1.01B | -1.57B | 70.79M | 5.88B | 4.62B |
| Operating Cash Flow | 0 | 7.87B | 9.10B | 6.37B | 8.36B | 8.73B |
| Investing Cash Flow | 0 | -8.86B | -11.26B | -5.63B | -2.49B | -5.15B |
| Financing Cash Flow | 0 | 261.41M | -2.69B | -52.65M | -3.71B | -3.86B |
Mie Kotsu Group Holdings, Inc. Technical Analysis
Price Trends
Market Momentum
Evaluating momentum and price trends is crucial in stock analysis to make informed investment decisions. For JP:3232, the sentiment is Positive. The current price of 571.00 is above the 20-day moving average (MA) of 568.15, below the 50-day MA of 575.21, and above the 200-day MA of 547.41, indicating a bullish trend. The MACD of 0.55 indicates Negative momentum. The RSI at 54.24 is Neutral, neither overbought nor oversold. The STOCH value of 51.82 is Neutral, not indicating any strong overbought or oversold conditions. Overall, these indicators collectively point to a Positive sentiment for JP:3232.
Mie Kotsu Group Holdings, Inc. Peers Comparison
Overall Rating
 JP:904182Outperform
 JP:904574Outperform
- JP:323265Neutral
 JP:900364Neutral
 JP:901063Neutral
 JP:904857Neutral
Financial Indicators
| Name | Overall Rating | Market Cap | P/E Ratio | ROE | Dividend Yield | Revenue Growth | EPS Growth |
|---|---|---|---|---|---|---|---|
| JP:9041 | 82Outperform | JPY 705.78B | 11.40 | 10.08% | 1.75% | 4.53% | 27.25% |
| JP:9045 | 74Outperform | JPY 344.30B | 9.89 | 10.21% | 2.93% | 15.20% | 24.14% |
| JP:3232 | 65Neutral | JPY 57.51B | 8.83 | ― | 3.64% | 10.87% | 10.26% |
| JP:9003 | 64Neutral | JPY 266.40B | 9.86 | ― | 2.76% | 10.64% | 33.97% |
| JP:9010 | 63Neutral | JPY 150.54B | 29.47 | ― | 1.13% | 2.31% | 4.24% |
| JP:9048 | 57Neutral | JPY 400.08B | 11.33 | ― | 1.97% | -1.28% | 28.52% |
| Sector * | 55Neutral | $6.65B | 3.83 | -15.92% | 6.20% | 10.91% | 7.18% |
* General Sector Average
Performance Comparison
| Show on chart | Ticker | Company Name | Price | Change | % Change |
|---|---|---|---|---|---|
| JP:3232 | Mie Kotsu Group Holdings, Inc. | 571.00 | 69.41 | 13.84% | |
| JP:9045 | Keihan Holdings Co | 3379.00 | 253.74 | 8.12% | |
| JP:9041 | Kintetsu Group Holdings Co | 3720.00 | 938.83 | 33.76% | |
| JP:9003 | Sotetsu Holdings, Inc. | 2695.00 | 122.87 | 4.78% | |
| JP:9010 | Fuji Kyuko Co., Ltd. | 2783.00 | 725.00 | 35.23% | |
| JP:9048 | Nagoya Railroad Co., Ltd. | 2024.00 | 463.12 | 29.67% |
Mie Kotsu Group Holdings, Inc. Corporate Events
Mie Kotsu Reports Higher First-Half Revenue and Profit
Mie Kotsu Group Holdings reported higher consolidated results for the six months ended September 30, 2026, with operating revenue rising 7.1% year over year to ¥53.482 billion. Operating profit increased 6.4% to ¥5.580 billion, ordinary profit rose 4...
Mie Kotsu Group Raises Interim Dividend and Sets 20-Yen Annual Payout
Mie Kotsu Group Holdings has approved an interim dividend of 11 yen per share for the six months ended September 30, 2026, unchanged from its earlier forecast and up from 8 yen a year earlier. The total interim payout will be about 1.11 billion yen,...
Disclaimer
This AI Analyst Stock Report is automatically generated by our AI systems using advanced algorithms and publicly available financial, technical, and market data. While the information provided aims to be accurate and insightful, it is intended for informational purposes only and should not be considered financial advice. Any content created by an AI (Artificial Intelligence) system may contain inaccuracies and/or contain errors. Investing in stocks carries inherent risks, and past performance is not indicative of future results. This report does not account for your personal financial circumstances, objectives, or risk tolerance. Always conduct your own research or consult with a qualified financial advisor before making investment decisions. The analysis and recommendations provided are based on historical and current data and may not fully reflect future market conditions or unexpected developments. Neither the creators of this report nor its affiliated entities guarantee the accuracy, completeness, or reliability of the information presented. Use this report at your own discretion and risk.
Date of analysis: Nov 17, 2026