


McEwen Mining AI Stock Analysis
McEwen Mining (1MUX) AI Stock Analysis

McEwen Mining
(Milan:1MUX)
No summary available
McEwen Mining (1MUX) vs. iShares MSCI Italy ETF (EWI)
- Market Cap
- EUR 782.95M
- Dividend Yield
- ―
- Average Volume (3M)
- 153
- Price to Earnings (P/E)
- 16.1
- Beta (1Y)
- 0.82
- Revenue Growth
- 38.66%
- EPS Growth
- ―
- Country
- Italy
- Employees
- 1,981
- Sector
- Basic Materials
- Sector Strength
- 61
- Industry
- Other Precious Metals
McEwen Mining Business Overview & Revenue Model
Company Description
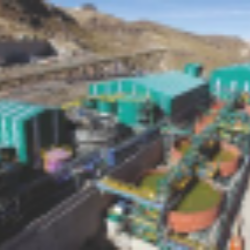
McEwen Mining Inc. (MUX) is primarily engaged in the discovery, development, extraction, and sale of gold and silver deposits across the United States, Canada, Mexico, and Argentina. The company also conducts exploration for copper reserves. Its port...
McEwen Mining Earnings Call Summary
The call had a mixed tone. Management openly characterized the third quarter as very difficult and unacceptable, with operational problems, elevated costs, weather-related disruption and uncommitted construction financing. However, it also highlighted improving October performance at Gold Bar and Fox, expected San Jose recovery, progress on Los Azules engineering and permitting, substantial liquidity and a plan to double production by 2030. The positive developments and recovery plans were meaningful but balanced by the severity of the reported quarter and execution risks.
Q3-2026 Updates
Positive Updates
Negative Updates
Company Guidance
Management said it remains on track to double gold production by 2030 to 250,000 to 300,000 ounces; Gold Bar was expected to produce a similar amount to October’s over 3,000 gold equivalent ounces in November and December and, as early budgeting was showing, every month, or on average every month in 2027; Fox costs were back within guidance in October and were expected to move lower; Stock benefits were expected to take hold in December and the beginning of the new year; Los Azules continued to target first copper in 2030 and FID with full project financing in mid-2027, with the updated feasibility study targeted for February 2027, site access expected in early 2027, and a 3,000-bed camp; San Jose was expected to have a very strong fourth quarter and meet its production guidance for the year, with no further dividends expected for the balance of 2026 and further additional dividends expected in 2027; and El Gallo spending was expected to be modest in Q4, with more consistent spend in the first half of 2027.
McEwen Mining Risk Analysis
McEwen Mining disclosed 49 risk factors in its most recent earnings report. McEwen Mining reported the most risks in the "Finance & Corporate" category.
Latest Risks Added
0 New RisksMcEwen Mining Peers Comparison
Overall Rating
 HL77Outperform
 BVN74Outperform
 LODE42Neutral
 PPTA41Neutral
Financial Indicators
| Name | Overall Rating | Market Cap | P/E Ratio | ROE | Dividend Yield | Revenue Growth | EPS Growth |
|---|---|---|---|---|---|---|---|
| HL | 77Outperform | $9.60B | 24.77 | 14.36% | 0.13% | 29.64% | 181.08% |
| BVN | 74Outperform | $7.05B | 5.52 | 28.08% | 4.35% | 64.00% | 176.61% |
| Sector * | 61Neutral | $10.43B | 7.12 | -0.05% | 2.87% | 2.86% | -36.73% |
| LODE | 42Neutral | $127.01M | -2.23 | -36.28% | ― | -52.21% | 61.28% |
| PPTA | 41Neutral | $2.42B | -9.97 | -31.72% | ― | ― | -506.49% |
* Basic Materials Sector Average
Performance Comparison
| Show on chart | Ticker | Company Name | Price | Change | % Change |
|---|---|---|---|---|---|
| IT:1MUX | McEwen Mining Inc | 11.69 | -3.31 | -22.07% | |
| BVN | Compania de Minas Buenaventura SAA | 26.10 | 3.28 | 14.36% | |
| LODE | Comstock Mining | 1.67 | -1.18 | -41.40% | |
| HL | Hecla Mining Company | 14.12 | -0.71 | -4.77% | |
| PPTA | Perpetua Resources Corp. | 18.94 | -3.05 | -13.87% | |
| SSMR | Sunshine Silver Mining & Refining Co. | 14.11 | -3.04 | -17.73% |
Disclaimer
This AI Analyst Stock Report is automatically generated by our AI systems using advanced algorithms and publicly available financial, technical, and market data. While the information provided aims to be accurate and insightful, it is intended for informational purposes only and should not be considered financial advice. Any content created by an AI (Artificial Intelligence) system may contain inaccuracies and/or contain errors. Investing in stocks carries inherent risks, and past performance is not indicative of future results. This report does not account for your personal financial circumstances, objectives, or risk tolerance. Always conduct your own research or consult with a qualified financial advisor before making investment decisions. The analysis and recommendations provided are based on historical and current data and may not fully reflect future market conditions or unexpected developments. Neither the creators of this report nor its affiliated entities guarantee the accuracy, completeness, or reliability of the information presented. Use this report at your own discretion and risk.