

Freeport-McMoRan (1FCX) AI Stock Analysis

Freeport-McMoRan
(Milan:1FCX)
No summary available
Freeport-McMoRan (1FCX) vs. iShares MSCI Italy ETF (EWI)
- Market Cap
- EUR 89.78B
- Dividend Yield
- 0.94%
- Average Volume (3M)
- 432
- Price to Earnings (P/E)
- 26.2
- Beta (1Y)
- 1.23
- Revenue Growth
- -4.14%
- EPS Growth
- ―
- Country
- Italy
- Employees
- 29,000
- Sector
- Basic Materials
- Sector Strength
- 61
- Industry
- Copper
Freeport-McMoRan Business Overview & Revenue Model
Company Description
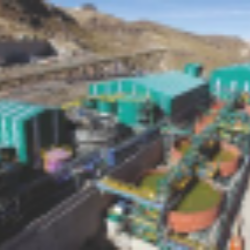
Freeport-McMoRan Inc. is a prominent mining enterprise conducting extensive operations across North America, South America, and Indonesia. The company primarily focuses on the exploration and extraction of key mineral resources such as copper, gold,...
Freeport-McMoRan Earnings Call Summary
The call was strongly positive overall. Management reported higher third-quarter earnings, significant Grasberg ramp-up progress, improving copper and gold volume prospects, a favorable copper-price and demand environment, substantial shareholder returns, and multiple organic growth opportunities. The main challenges were lower 2026 and 2027 copper sales estimates, weather and water constraints, low U.S. ore grades and recovery variability, higher energy and capital costs, and uncertainty around the field performance of the next-generation leach additive.
Q3-2026 Updates
Positive Updates
Negative Updates
Company Guidance
Freeport expects fourth quarter 2026 sales volumes to be the highest of the year, with copper sales increasing 17% and gold sales nearly tripling from third quarter levels; 2026 copper sales were trimmed by approximately 2% and 2027 by approximately 2.5%, while 2027 copper sales are expected to grow over 20% and gold volumes more than 50%, followed by 10% copper growth and 20% gold growth in 2028. Grasberg is targeted to reach 80% overall rates by mid-2027 and approach full capacity by the end of next year, with copper production positioned to grow from GBP 3 billion this year to GBP 3.7 billion in 2027 and over GBP 4 billion in 2028. Full-year 2026 net unit cash cost guidance remains $1.90 per pound; modeled annual EBITDA ranges from over $12 billion per annum at $5 copper to $19.5 billion at $7 copper, with operating cash flows ranging from over $9 billion per year at $5 to approximately $15 billion at $7 copper. Capital expenditure is estimated to approximate $4.4 billion in 2026 and $5.2 billion for 2027, including discretionary projects of approximately $1.6 billion and $2 billion, respectively. Leach production is targeted at GBP 300 million in 2027 versus just over GBP 200 million in 2026, with an aspiration to reach GBP 800-million by 2030, while the Bagdad expansion remains at a $4.5 billion estimate, is expected to come in around 3.5 years from the final decision, and could add GBP 200 million-GBP 250 million a year of copper and GBP 10 million-GBP 12 million a year of molybdenum.
Freeport-McMoRan Risk Analysis
Freeport-McMoRan disclosed 31 risk factors in its most recent earnings report. Freeport-McMoRan reported the most risks in the "Production" category.
Latest Risks Added
0 New RisksFreeport-McMoRan Peers Comparison
Overall Rating
 NEM77Outperform
 SCCO76Outperform
 BVN74Outperform
 RIO62Neutral
 VALE56Neutral
Financial Indicators
| Name | Overall Rating | Market Cap | P/E Ratio | ROE | Dividend Yield | Revenue Growth | EPS Growth |
|---|---|---|---|---|---|---|---|
| NEM | 77Outperform | $110.79B | 12.34 | 26.45% | 0.97% | 23.41% | 33.87% |
| SCCO | 76Outperform | $149.89B | 23.24 | 51.96% | 2.20% | 38.69% | 66.94% |
| BVN | 74Outperform | $7.24B | 5.96 | 27.66% | 4.30% | 67.75% | 122.36% |
| RIO | 62Neutral | $140.86B | 10.99 | 18.86% | 5.68% | 14.26% | 17.02% |
| Sector * | 61Neutral | $10.43B | 7.12 | -0.05% | 2.87% | 2.86% | -36.73% |
| VALE | 56Neutral | $45.46B | 22.80 | 1.93% | 9.34% | 10.51% | -88.83% |
* Basic Materials Sector Average
Performance Comparison
| Show on chart | Ticker | Company Name | Price | Change | % Change |
|---|---|---|---|---|---|
| IT:1FCX | Freeport-McMoRan, Inc. | 56.51 | 21.63 | 62.00% | |
| BVN | Compania de Minas Buenaventura SAA | 26.42 | 5.22 | 24.63% | |
| NEM | Newmont Mining | 106.61 | 25.75 | 31.84% | |
| RIO | Rio Tinto | 81.89 | 14.88 | 22.20% | |
| SCCO | Southern Copper Corp | 177.53 | 47.41 | 36.43% | |
| VALE | Vale SA | 11.39 | 0.02 | 0.19% |
Disclaimer
This AI Analyst Stock Report is automatically generated by our AI systems using advanced algorithms and publicly available financial, technical, and market data. While the information provided aims to be accurate and insightful, it is intended for informational purposes only and should not be considered financial advice. Any content created by an AI (Artificial Intelligence) system may contain inaccuracies and/or contain errors. Investing in stocks carries inherent risks, and past performance is not indicative of future results. This report does not account for your personal financial circumstances, objectives, or risk tolerance. Always conduct your own research or consult with a qualified financial advisor before making investment decisions. The analysis and recommendations provided are based on historical and current data and may not fully reflect future market conditions or unexpected developments. Neither the creators of this report nor its affiliated entities guarantee the accuracy, completeness, or reliability of the information presented. Use this report at your own discretion and risk.