


Tera Light AI Stock Analysis
Want to see IL:TRLT full AI Analyst Report?
Tera Light (TRLT) AI Stock Analysis

Tera Light
(TASE:TRLT)
Tera Light scores poorly, driven primarily by a stretched financial profile: a nearly $1 billion debt load at more than twice equity, deeply negative free cash flow of about -$160M from ongoing project spending, and continued net losses. The investment case rests on newly commissioned assets converting into sustained cash flow fast enough to service that debt. There are real bright spots — operating margins have turned solidly positive, EBITDA is strong, net losses have narrowed sharply from 2024, and operating cash flow has flipped positive — but consistency is unproven and revenue remains volatile. Technicals reinforce caution, with the price below all key moving averages and negative MACD momentum. Valuation adds no cushion given negative earnings and no dividend, though the low beta of 0.81 tempers volatility risk.
Tera Light (TRLT) vs. iShares MSCI Israel ETF (EIS)
- Market Cap
- ILS 975.22M
- Dividend Yield
- ―
- Average Volume (3M)
- 36.05K
- Price to Earnings (P/E)
- -229.9
- Beta (1Y)
- 0.97
- Revenue Growth
- ―
- EPS Growth
- ―
- Country
- Israel
- Employees
- 45
- Sector
- General
- Sector Strength
- 55
- Industry
- Renewable Utilities
Tera Light Business Overview & Revenue Model
Company Description
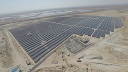
Tera Light Ltd engages in the construction, operation, and maintenance of photovoltaic systems in Israel. It engages in the provision of large ground-based photovoltaic installations; and construction, operation, and maintenance of small dual-use sol...
Tera Light Financial Statement Overview
Summary
Weak overall, though improving. The income statement (45) shows genuine operating progress — gross margin near 32%, operating margin swinging to +22% and EBITDA margin around 61% — but revenue is highly erratic (a collapse to $20M in 2024 before rebounding, with TTM revenue down ~3.6%) and the company remains net loss-making at -$4.3M (-7.1% margin). The balance sheet (38) is the biggest concern: total debt has ballooned from $43M to $959M, debt-to-equity sits at roughly 2.1x, debt funds about 62% of assets, and equity has stayed flat near $406M, leaving thin cushion against interest-rate or project cash flow disappointment. Cash flow (36) is the weakest link — operating cash flow has only recently turned positive ($5.9M TTM) while free cash flow remains deeply negative at about -$160M due to heavy construction spending, leaving the company dependent on lenders and capital markets to fund growth.
Income Statement
45NeutralBalance Sheet
38NegativeCash Flow
36Negative| Breakdown | TTM | Dec 2025 | Dec 2024 | Dec 2023 | Dec 2022 | Dec 2021 |
|---|---|---|---|---|---|---|
Income Statement | ||||||
| Total Revenue | 72.77M | 75.91M | 20.09M | 79.81M | 56.23M | 18.09M |
| Gross Profit | 27.05M | 25.37M | 5.54M | 21.98M | 19.75M | 5.13M |
| EBITDA | 48.14M | 43.00M | -14.10M | 7.88M | -4.56M | -5.88M |
| Net Income | -4.33M | -6.77M | -40.41M | -11.38M | -8.35M | -7.46M |
Balance Sheet | ||||||
| Total Assets | 1.56B | 1.42B | 1.26B | 1.17B | 587.29M | 492.27M |
| Cash, Cash Equivalents and Short-Term Investments | 176.21M | 163.16M | 67.34M | 191.37M | 64.05M | 168.06M |
| Total Debt | 959.37M | 888.21M | 805.56M | 701.51M | 159.64M | 42.94M |
| Total Liabilities | 1.10B | 959.50M | 895.59M | 745.03M | 219.34M | 128.50M |
| Stockholders Equity | 405.85M | 411.13M | 303.36M | 345.19M | 352.29M | 357.60M |
Cash Flow | ||||||
| Free Cash Flow | -159.70M | -75.88M | -155.23M | -427.67M | -182.32M | -98.21M |
| Operating Cash Flow | 5.85M | 25.79M | -15.30M | -47.85M | -26.55M | -17.81M |
| Investing Cash Flow | -157.16M | -22.95M | -132.00M | -446.82M | -155.32M | -166.90M |
| Financing Cash Flow | 228.65M | 140.34M | 87.91M | 501.69M | 68.69M | 308.40M |
Tera Light Technical Analysis
Price Trends
Market Momentum
Evaluating momentum and price trends is crucial in stock analysis to make informed investment decisions. For IL:TRLT, the sentiment is Negative. The current price of 1235.00 is below the 20-day moving average (MA) of 1407.25, below the 50-day MA of 1516.32, and below the 200-day MA of 1735.47, indicating a bearish trend. The MACD of -78.38 indicates Positive momentum. The RSI at 26.12 is Positive, neither overbought nor oversold. The STOCH value of 19.35 is Positive, not indicating any strong overbought or oversold conditions. Overall, these indicators collectively point to a Negative sentiment for IL:TRLT.
Tera Light Peers Comparison
Overall Rating
 IL:ECNR55Neutral
 IL:ENLT53Neutral
 IL:ELLO46Neutral
 IL:MSKE45Neutral
- IL:TRLT40Underperform
 IL:ENRG38Underperform
Financial Indicators
| Name | Overall Rating | Market Cap | P/E Ratio | ROE | Dividend Yield | Revenue Growth | EPS Growth |
|---|---|---|---|---|---|---|---|
| Sector * | 55Neutral | $6.65B | 3.83 | -15.92% | 6.20% | 10.91% | 7.18% |
| IL:ECNR | 55Neutral | ILS 4.59B | -20.95 | ― | ― | 2.40% | -570.07% |
| IL:ENLT | 53Neutral | ILS 30.19B | 94.34 | 2.17% | ― | 19.91% | -40.91% |
| IL:ELLO | 46Neutral | ILS 805.08M | 3.79 | -1.46% | ― | -1.19% | ― |
| IL:MSKE | 45Neutral | ILS 6.70B | -52.98 | ― | ― | ― | ― |
| IL:TRLT | 40Underperform | ILS 994.96M | -229.93 | ― | ― | ― | ― |
| IL:ENRG | 38Underperform | ILS 11.67B | 78.16 | ― | 2.05% | 18.55% | -36.00% |
* General Sector Average
Performance Comparison
| Show on chart | Ticker | Company Name | Price | Change | % Change |
|---|---|---|---|---|---|
| IL:TRLT | Tera Light Ltd. | 1235.00 | 83.00 | 7.20% | |
| IL:ELLO | Ellomay Capital Ltd Ordinary Sh | 5745.00 | -935.00 | -14.00% | |
| IL:ENLT | Enlight Renewable Energy Ltd | 21560.00 | 9360.00 | 76.72% | |
| IL:ENRG | Energix-Renewable Energies Ltd. | 1949.00 | 584.28 | 42.81% | |
| IL:MSKE | Meshek Energy Renewable Energies Ltd. | 903.50 | 253.60 | 39.02% | |
| IL:ECNR | Econergy renewable energy Ltd | 5857.00 | 1545.00 | 35.83% |
Disclaimer
This AI Analyst Stock Report is automatically generated by our AI systems using advanced algorithms and publicly available financial, technical, and market data. While the information provided aims to be accurate and insightful, it is intended for informational purposes only and should not be considered financial advice. Any content created by an AI (Artificial Intelligence) system may contain inaccuracies and/or contain errors. Investing in stocks carries inherent risks, and past performance is not indicative of future results. This report does not account for your personal financial circumstances, objectives, or risk tolerance. Always conduct your own research or consult with a qualified financial advisor before making investment decisions. The analysis and recommendations provided are based on historical and current data and may not fully reflect future market conditions or unexpected developments. Neither the creators of this report nor its affiliated entities guarantee the accuracy, completeness, or reliability of the information presented. Use this report at your own discretion and risk.
Date of analysis: Aug 29, 2026