


Ellomay AI Stock Analysis
Want to see IL:ELLO full AI Analyst Report?
Ellomay (ELLO) AI Stock Analysis

Ellomay
(TASE:ELLO)
Ellomay scores poorly, driven primarily by a fragile financial profile: ~5.1x debt-to-equity leverage, compressed margins, an operating loss, and negative operating cash flow alongside a -$135.5M free cash flow burn from heavy project spending. Technicals reinforce the caution, with the price below all key moving averages and negative MACD momentum. The main offset is a very low P/E of 3.9, though that figure is flattered by non-recurring items, and no dividend is paid. The investment case rests on newly commissioned renewable capacity converting capital spending into recurring contracted cash flow; until operating cash flow turns positive and leverage eases, funding and dilution risk dominate.
Ellomay (ELLO) vs. iShares MSCI Israel ETF (EIS)
- Market Cap
- ILS 817.21M
- Dividend Yield
- ―
- Average Volume (3M)
- 6,741
- Price to Earnings (P/E)
- 3.8
- Beta (1Y)
- 0.87
- Revenue Growth
- -1.19%
- EPS Growth
- ―
- Country
- Israel
- Employees
- 29
- Sector
- General
- Sector Strength
- 55
- Industry
- Renewable Utilities
Ellomay Business Overview & Revenue Model
Company Description
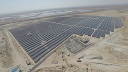
Ellomay Capital Ltd. is an energy company operating across Israel, Spain, and the Netherlands, dedicated to producing renewable and clean power. Its assets include six operational photovoltaic (PV) plants: four located in Spain with a cumulative capa...
Ellomay Financial Statement Overview
Summary
Weak across all three statements. Revenue has slid from $52.2M (2022) to $33.9M (2025) before a TTM rebound to $43.9M, but gross margin collapsed from ~47% to ~20% and the company posted a $2.3M operating loss (-10% margin) with ROE near -15%. The balance sheet is aggressively leveraged: total debt of $659M against $209M of equity (~5.1x D/E), funding roughly 69% of a $952M asset base. Cash generation is the weakest link — operating cash flow has fallen every year and is now negative at -$4.3M TTM, with free cash flow burn widening to -$135.5M as the project build-out continues. Positives include positive EBITDA of $12.8M (29% margin), a materially expanded asset base, and equity strengthening from $141M to $209M, but reliance on external funding keeps the financial profile fragile.
Income Statement
34NegativeBalance Sheet
32NegativeCash Flow
25Negative| Breakdown | TTM | Mar 2026 | Mar 2025 | Dec 2023 | Dec 2022 | Mar 2022 |
|---|---|---|---|---|---|---|
Income Statement | ||||||
| Total Revenue | 43.92M | 33.89M | 40.47M | 48.83M | 52.24M | 44.78M |
| Gross Profit | 6.65M | 7.21M | 4.78M | 21.51M | 24.79M | 12.18M |
| EBITDA | 12.74M | 24.76M | 20.43M | 29.50M | 26.98M | 19.82M |
| Net Income | 59.87M | -2.13M | -6.52M | 2.22M | -357.00K | -15.09M |
Balance Sheet | ||||||
| Total Assets | 952.06M | 845.45M | 677.26M | 612.85M | 576.16M | 551.15M |
| Cash, Cash Equivalents and Short-Term Investments | 166.14M | 88.26M | 41.13M | 52.12M | 49.29M | 71.58M |
| Total Debt | 659.35M | 637.86M | 521.06M | 446.40M | 407.04M | 376.32M |
| Total Liabilities | 721.47M | 679.97M | 547.97M | 487.75M | 493.08M | 437.66M |
| Stockholders Equity | 208.80M | 140.93M | 118.62M | 115.00M | 95.72M | 115.52M |
Cash Flow | ||||||
| Free Cash Flow | -135.46M | -93.52M | -67.47M | -52.53M | -37.29M | -67.57M |
| Operating Cash Flow | -4.29M | 8.21M | 7.97M | 8.60M | 11.32M | 15.24M |
| Investing Cash Flow | -6.53M | -47.65M | -64.44M | -55.55M | -24.38M | -107.42M |
| Financing Cash Flow | 55.36M | 82.61M | 42.96M | 54.43M | 26.51M | 54.20M |
Ellomay Peers Comparison
Overall Rating
 IL:ECNR55Neutral
 IL:ENLT53Neutral
 IL:DORL45Neutral
 IL:ENRG44Neutral
 IL:MSKE42Neutral
- IL:ELLO39Underperform
Financial Indicators
| Name | Overall Rating | Market Cap | P/E Ratio | ROE | Dividend Yield | Revenue Growth | EPS Growth |
|---|---|---|---|---|---|---|---|
| Sector * | 55Neutral | $6.65B | 3.83 | -15.92% | 6.20% | 10.91% | 7.18% |
| IL:ECNR | 55Neutral | ILS 4.44B | -20.06 | ― | ― | 2.40% | -570.07% |
| IL:ENLT | 53Neutral | ILS 29.82B | 91.95 | 2.17% | ― | 19.91% | -40.91% |
| IL:DORL | 45Neutral | ILS 12.33B | -44.07 | ― | ― | 53.62% | -34.45% |
| IL:ENRG | 44Neutral | ILS 11.23B | 104.57 | ― | 2.13% | 36.50% | -62.35% |
| IL:MSKE | 42Neutral | ILS 6.39B | -50.56 | ― | ― | ― | ― |
| IL:ELLO | 39Underperform | ILS 817.62M | 3.82 | -1.46% | ― | -1.19% | ― |
* General Sector Average
Performance Comparison
| Show on chart | Ticker | Company Name | Price | Change | % Change |
|---|---|---|---|---|---|
| IL:ELLO | Ellomay Capital Ltd Ordinary Sh | 5900.00 | -761.00 | -11.42% | |
| IL:ENLT | Enlight Renewable Energy Ltd | 21250.00 | 9000.00 | 73.47% | |
| IL:ENRG | Energix-Renewable Energies Ltd. | 1881.00 | 513.35 | 37.53% | |
| IL:DORL | DORAL GROUP RENEWABLE ENERGY RESOURCES LTD | 5366.00 | 2860.00 | 114.13% | |
| IL:MSKE | Meshek Energy Renewable Energies Ltd. | 822.30 | 190.10 | 30.07% | |
| IL:ECNR | Econergy renewable energy Ltd | 5795.00 | 1574.00 | 37.29% |
Disclaimer
This AI Analyst Stock Report is automatically generated by our AI systems using advanced algorithms and publicly available financial, technical, and market data. While the information provided aims to be accurate and insightful, it is intended for informational purposes only and should not be considered financial advice. Any content created by an AI (Artificial Intelligence) system may contain inaccuracies and/or contain errors. Investing in stocks carries inherent risks, and past performance is not indicative of future results. This report does not account for your personal financial circumstances, objectives, or risk tolerance. Always conduct your own research or consult with a qualified financial advisor before making investment decisions. The analysis and recommendations provided are based on historical and current data and may not fully reflect future market conditions or unexpected developments. Neither the creators of this report nor its affiliated entities guarantee the accuracy, completeness, or reliability of the information presented. Use this report at your own discretion and risk.
Date of analysis: Nov 06, 2026