


Eagle Point Credit Company earnings date
Want to see ECC full AI Analyst Report?
Eagle Point Credit Company (ECC) Q3 2026 Earnings Report
ECC Q3 2026 EPS Results
- Actual EPS
- -$0.12
- Consensus EPS
- ―
- Beat/Miss
- ―
- One Year Ago EPS
- $0.24
ECC Q3 2026 Revenue Results
- Actual Revenue
- $63.70M
- Expected Revenue
- ―
- Beat/Miss
- ―
- YoY Revenue Growth
- +55.43%
Earnings Announcement Details
- Quarter
- Q3 2026
- Date
- 11/13/2026
- Time
- During Market Hours
- Conference Call
- Friday, November 13, 2026
Eagle Point Credit Company's next earnings date is estimated for February 23, 2027, based on past reporting schedules.
Q3 2026 Earnings Call Audio
No earnings call audio is available for this earnings event.
Q3 2026 Earnings Slide Deck
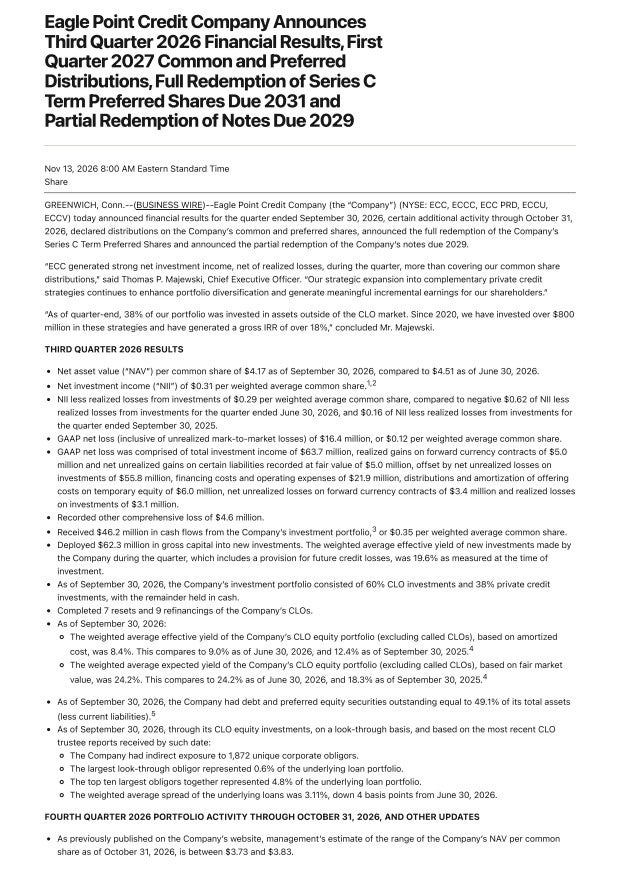
Q3 2026 Earnings Call Summary
The call was constructive about ECC's diversification into private credit, investment cash flows, CLO refinancing opportunities, and the long-term return potential of the broader Eagle Point platform. However, the company continues to face meaningful pressure from lower CLO equity valuations, spread compression, declining NAV, elevated leverage relative to its target range, and uncertainty in the loan market. The number and strength of the stated operational and investment positives outweighed the challenges, although the outlook remains dependent on continued portfolio diversification and improved CLO market conditions.
Management declared monthly distributions of $0.06 per share for the first 3 months of 2027 and believes the current distribution level is appropriately aligned with the company’s earnings potential and represents a sustainable distribution over time; it collected $42 million in cash flows from the investment portfolio during October and expects additional collections during the remainder of the quarter. Management’s unaudited estimate of NAV as of October month end was between $3.73 and $3.83 per share, the midpoint being a 9% decrease from quarter end. The long-term leverage target range is between 27.5% and 37.5%, with a focus on returning leverage to within that target range over time, and there are no debt maturities before January 2029. Management expects CLOs to continue to become a smaller portion of the portfolio over time; non-CLO investments are limited up to 50% of the portfolio, with the company roughly at 40%, and the pipeline’s return opportunity is in the mid-teens in general.
- Net Investment Income Covered DistributionsThird-quarter net investment income less realized losses was $0.29 per share, well in excess of total distributions of $0.18 per share. Results included a $0.11 per-share contribution from the early repayment of a private infrastructure credit investment; normalized net investment income plus realized gains was $0.18 per share, in line with distributions.
- Strong Investment Cash FlowsCash flows from investments totaled $46 million, or $0.35 per share, during the quarter and fully covered common distributions and total expenses.
- Expansion of Diversified Private Credit PortfolioPrivate credit investments outside CLO equity represented about 38% of the total portfolio as of September 30, more than double the 16% level a year earlier. Management expects this portion of the portfolio to become an even bigger part of the portfolio in coming quarters.
- Attractive Private Credit Investment Track RecordSince 2020, ECC has invested over $800 million in credit assets beyond CLOs and generated a gross IRR of approximately 18%, excluding company-level expenses. Nearly $350 million of those investments had been fully realized, generating a gross IRR of approximately 28%.
- Successful CLO Refinancings and ResetsECC completed 7 CLO resets and 9 refinancings during the quarter, producing weighted average CLO debt cost savings of 20 basis points for the reopened CLOs. The transactions also extended their reinvestment periods to 5 years.
- Pipeline for Additional CLO Financing SavingsApproximately 25% of the CLO equity portfolio has AAA spreads above 130 basis points and is expected to exit its non-call period over the next year, providing additional refinancing and reset opportunities.
- Extended CLO Reinvestment RunwayThe CLO equity portfolio's weighted average remaining reinvestment period increased to 3.6 years from 3.4 years at June 30, which management said was 20% above the broader market average.
- New Investment Deployment at High YieldECC deployed $62 million into new investments during the quarter at a weighted average effective yield of 19.6%.
- Favorable New CLO ArrangementsECC opportunistically originated 2 new CLO transactions and negotiated particularly favorable collateral manager fee arrangements, including some of the most attractive rebates it has achieved in more than a decade of investing in the CLO asset class.
- Progress with Muzinich PartnershipThe inaugural Muzinich European CLO closed during the third quarter, the second European CLO was recently priced, and the platform has an active issuance pipeline. In the U.S., ECC completed a reset extending one platform CLO to a new 5-year reinvestment period and is warehousing the platform's eighth new issue.
- Stable Distribution OutlookECC paid three monthly distributions of $0.06 per common share during the third quarter and declared monthly distributions of $0.06 per share for the first three months of 2027. Management said the current distribution level is appropriately aligned with earnings potential and represents a sustainable distribution over time.
- Long-Duration Financing StructureECC had no debt maturities before January 2029, and all debt and preferred equity financing was fixed rate. A significant portion of preferred equity financing was perpetual with no set maturity date, which management described as providing stability and flexibility.
- Continued Investment Cash CollectionsECC collected $42 million in cash flows from its investment portfolio during October and expected additional collections during the remainder of the fourth quarter.
- Successful Nexus Infrastructure Credit InvestmentA Nexus investment acquired for $72 million had a fair value of $94 million at June 30, with the approximately $22 million difference related to a minimum multiple on invested capital that was realized as income upon refinancing on July 30. Management said the investment continued to perform well.
- Robust Private Credit PipelineManagement described the private credit pipeline as robust across almost every sector outside the CLO portfolio, with mid-teens total-return opportunities and a preference for investments with strong structure, collateral protection, credit downside protection, and potential equity upside.
- Software Loan Market StabilizationManagement cited relatively limited default activity in the software sector and a 3.3% increase in loan prices since the end of the first quarter. Management said concerns about AI disruption may be overstated for many mission-critical software businesses with strong customer retention and recurring revenues under long-term contracts.
ECC Earnings History
| Report Date | Fiscal Quarter | Forecast / EPS | Last Year's EPS | EPS YoY Change | Press Release |
|---|---|---|---|---|---|
| Feb 23, 2027 | 2026 (Q4) | ―- | 0.23 | ― | ― |
| Nov 13, 2026 | 2026 (Q3) | ―-0.12 | 0.24 | -150.00% (-0.36) | |
| Aug 13, 2026 | 2026 (Q2) | 0.180.53 | 0.22 | 140.91% (+0.31) | |
| May 19, 2026 | 2026 (Q1) | 0.230.20 | 0.28 | -28.57% (-0.08) | |
| Feb 17, 2026 | 2025 (Q4) | 0.220.23 | 0.24 | -4.17% (-0.01) | |
| Nov 13, 2025 | 2025 (Q3) | 0.230.24 | 0.29 | -17.24% (-0.05) | |
| Aug 12, 2025 | 2025 (Q2) | 0.260.22 | 0.28 | -21.43% (-0.06) | |
| May 28, 2025 | 2025 (Q1) | 0.260.28 | 0.29 | -3.45% (-0.01) | |
| Feb 20, 2025 | 2024 (Q4) | 0.280.24 | 0.33 | -27.27% (-0.09) | |
| Nov 14, 2024 | 2024 (Q3) | 0.280.29 | 0.35 | -17.14% (-0.06) |
The table shows recent earnings report dates and whether the forecast was beat or missed. See the change in forecast and EPS from the previous year.
