

Altius Minerals (VTM) Q2 2026 Earnings Report
DE:VTM Q2 2026 EPS Results
- Actual EPS
- EUR 0.09
- Consensus EPS
- EUR 0.13
- Beat/Miss
- Missed by -EUR 0.04
- One Year Ago EPS
- EUR 0.02
DE:VTM Q2 2026 Revenue Results
- Actual Revenue
- EUR 12.82M
- Expected Revenue
- EUR 17.31M
- Beat/Miss
- Missed by -EUR 4.49M
- YoY Revenue Growth
- +137.47%
Earnings Announcement Details
- Quarter
- Q2 2026
- Date
- 08/10/2026
- Time
- After Close
- Conference Call
- Monday, August 10, 2026
Altius Minerals's next earnings date is estimated for November 10, 2026, based on past reporting schedules.
Q2 2026 Earnings Call Audio
No earnings call audio is available for this earnings event.
Q2 2026 Earnings Slide Deck
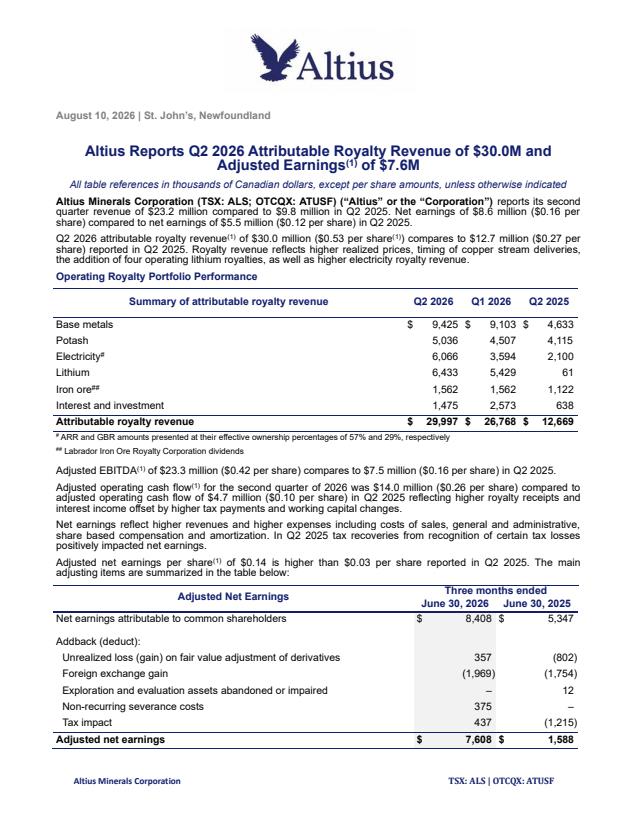
Q2 2026 Earnings Call Summary
The call emphasized multiple strategic achievements: record royalty revenue, strong adjusted EBITDA, successful equity raise (CAD 174M), credit facility expansion to CAD 350M, increased ownership in GBR to 50%, substantial liquidity (~CAD 500M), and positive commodity price trends (copper/nickel +~4% QoQ; lithium ~4x year-ago). These positives were balanced against higher operating expenses, nonrecurring acquisition costs, working capital and tax outflows, increased short-term leverage (CAD 100M drawdown) to fund acquisitions, and some asset-level production headwinds and commodity price volatility. Overall, management portrayed confident growth prospects—particularly in lithium and electricity royalties—while acknowledging near-term costs and market volatility.
Guidance from the call emphasized upward revenue expectations for lithium and accelerating electricity-royalty cashflows while reinforcing a strong liquidity and capital position: management said it has revised lithium revenue estimates higher for the next several years (citing very tight inventories—below ~1 month—and industry metrics like ~3 TWh of battery shipments vs ~10 GWh sodium this year, and ~70% YoY growth in energy storage shipments), noted average lithium prices remain ~4x year‑ago levels with material sequential improvement, and reported copper and nickel quarterly average prices up ~4% vs Q1; the ARR/electricity portfolio is entering an inflection with 16 operating projects and 15 in construction (including a 311 MW Coles Wind contribution of USD 12.4M), Altius increased its effective interest in GBR from 29% to 50% (to be equity‑accounted), and the company expects growing near‑term electricity royalty revenue. Key financial and liquidity metrics cited: Q2 net earnings CAD 8.6M (CAD 0.16/share), royalty revenue CAD 30M (record), adjusted EBITDA CAD 23M, operating cash flow CAD 14M, adjusted EPS CAD 0.14; recent transactions include a bought‑deal of 3.0M shares at CAD 60.50 raising net proceeds CAD 174M, an amended revolver upsized to CAD 350M (from CAD 225M) with CAD 163M available now and a CAD 150M accordion, a CAD 100M drawdown, CAD 87M debt transferred and maturity extended to July 2030, approx. CAD 500M total liquidity, CAD 2M scheduled debt repayments in the quarter, CAD 5.2M cash dividends paid (≈7,000 shares issued under DRIP) and a Board‑approved 10% dividend increase to CAD 0.11/share; adjusting items included FX, derivative revaluations and nonrecurring LRC acquisition costs.
- Record Royalty Revenue and Strong ProfitabilityQ2 net earnings of CAD 8.6 million (CAD 0.16 per share); record royalty revenue of CAD 30 million and adjusted EBITDA of CAD 23 million. Adjusted net earnings were CAD 0.14 per share, higher than Q2 2025.
- Solid Cash Generation and Balance Sheet ActionsOperating cash flow of CAD 14 million driven by higher royalty receipts and interest income. Subsequent to quarter-end, completed a bought deal raising net proceeds of CAD 174 million (3.0 million shares at CAD 60.50) and upsized the credit facility from CAD 225 million to CAD 350 million (≈+55.6%), including a CAD 100 million drawdown on the revolver. Current total liquidity of approximately CAD 500 million (includes CAD 163 million available on revolver and CAD 150 million accordion).
- Strategic M&A and Portfolio RepositioningIncreased effective interest in Great Bay Renewables (GBR) from 29% to 50% (will be equity accounted at 50% going forward). Added four operating lithium royalties via LRC integration and made targeted investments including Coles Wind (311 MW construction-stage project for USD 12.4 million) and CAD 15 million in other investments (TNR Gold, Blue Moon). Received CAD 42 million from winding up of legacy Royalty Capital Funds.
- Dividend Increase and Shareholder ReturnsBoard approved a 10% dividend increase to CAD 0.11 per share (record date Aug 28, payment Sept 15). Paid CAD 5.2 million in cash dividends during the quarter and issued ~7,000 common shares under the dividend reinvestment plan.
- Growing Electricity Royalties (ARR/GBR) MomentumARR/GBR portfolio now includes 16 operating-stage projects and 15 in construction; new advanced-stage Coles Wind investment expected to add near-term revenue and contribute to an upward inflection in electricity royalty revenue.
- Positive Commodity Price and Market SignalsAverage quarterly copper and nickel prices increased ~4% QoQ. Lithium market reported materially higher prices (management noted lithium prices are ~4x year-ago levels) and very tight physical inventories, prompting upward revisions to the company’s lithium revenue estimates over the next several years.
DE:VTM Earnings History
| Report Date | Fiscal Quarter | Forecast / EPS | Last Year's EPS | EPS YoY Change | Press Release |
|---|---|---|---|---|---|
| Nov 10, 2026 | 2026 (Q3) | 0.15- | 0.11 | ― | ― |
| Aug 10, 2026 | 2026 (Q2) | 0.130.09 | 0.02 | 366.67% (+0.07) | |
| May 12, 2026 | 2026 (Q1) | 0.120.07 | 0.03 | 120.00% (+0.04) | |
| Mar 10, 2026 | 2025 (Q4) | 0.090.15 | 0.04 | 300.00% (+0.11) | |
| Nov 11, 2025 | 2025 (Q3) | 0.080.11 | 0.03 | 240.00% (+0.08) | |
| Aug 11, 2025 | 2025 (Q2) | 0.030.02 | 0.06 | -66.67% (-0.04) | |
| May 13, 2025 | 2025 (Q1) | 0.040.03 | 0.04 | -28.57% (-0.01) | |
| Mar 11, 2025 | 2024 (Q4) | 0.030.04 | 0.04 | 0.00% (+0.00) | |
| Nov 07, 2024 | 2024 (Q3) | 0.050.03 | 0.03 | 0.00% (+0.00) | |
| Aug 08, 2024 | 2024 (Q2) | 0.070.06 | 0.04 | 50.00% (+0.02) |
The table shows recent earnings report dates and whether the forecast was beat or missed. See the change in forecast and EPS from the previous year.