

Hut 8 (V71) Q2 2026 Earnings Report
DE:V71 Q2 2026 EPS Results
- Actual EPS
- -EUR 1.14
- Consensus EPS
- -EUR 0.49
- Beat/Miss
- Missed by -EUR 0.65
- One Year Ago EPS
- EUR 1.06
DE:V71 Q2 2026 Revenue Results
- Actual Revenue
- EUR 67.36M
- Expected Revenue
- EUR 71.34M
- Beat/Miss
- Missed by -EUR 3.99M
- YoY Revenue Growth
- +81.44%
Earnings Announcement Details
- Quarter
- Q2 2026
- Date
- 08/04/2026
- Time
- Before Open
- Conference Call
- Tuesday, August 4, 2026
Hut 8's next earnings date is estimated for November 4, 2026, based on past reporting schedules.
Q2 2026 Earnings Call Audio
No earnings call audio is available for this earnings event.
Q2 2026 Earnings Slide Deck
Q2 2026 Earnings Call Summary
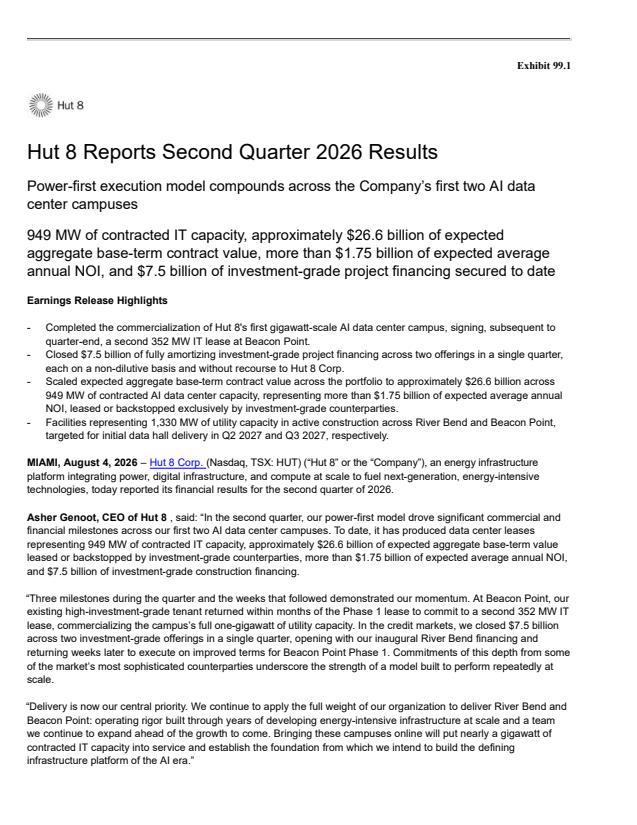
The call emphasized meaningful operational progress (revenue +81% YoY), margin expansion, improved adjusted EBITDA, a sizable and higher-quality development pipeline (8.7 GW), and two landmark investment-grade, nonrecourse project financings totaling ~$7.5B that validate the repeatable capital formation model. Key near-term negatives are a large GAAP net loss driven by bitcoin mark-to-market, a noticeable increase in reported G&A (largely non-cash), higher consolidated debt on the balance sheet (although largely ring-fenced), and regulatory/community development risks in some markets. On balance, the highlights—robust revenue and margin improvement, proof points of scalable financing, and a growing contracted AI data center backlog—outweigh the lowlights tied mainly to non-cash accounting swings and transitional costs, supporting a constructive view of the company’s platform evolution.
Management’s guidance emphasized transitioning to long‑duration contracted digital infrastructure while the operating business strengthens: revenue rose ~81% YoY to $74.9M, gross profit ≈$48M (gross margin ≈64% vs 47% LY), adjusted EBITDA ex‑digital‑asset mark‑to‑market $10.4M (vs $4.2M), and a GAAP net loss of $177.1M driven by a $138M digital‑asset mark‑to‑market swing; compute revenue was $72.5M (bitcoin mined up from ~308 to ~935, segment margin ~66%), digital infrastructure revenue $1.3M and power revenue $1.2M. Capital formation was a focal point: Hut 8 raised ~$7.5B of investment‑grade, nonrecourse, fully amortizing project financing ($3.25B River Bend notes, $4.25B Beacon Point notes), bringing consolidated cash and restricted cash to ~ $7.0B (unrestricted ~$233.6M, restricted ~$6.8B) and total debt to ~ $7.6B; interest income on undrawn proceeds was $27.1M and $5.7M of interest was capitalized. On development, the pipeline is ~8.7 GW (up ~300MW QoQ) with 11 sites in diligence/exclusivity averaging >650MW (exclusivity +200MW), Beacon Point now 704MW (~$19.6B expected base‑term value) including a 352MW Building 2 (~$9.8B), River Bend + Beacon Point total contracted AI capacity ~949MW (~$26.6B aggregate base‑term value), and management reiterated ~99% NOI on triple‑net leases and an expected ≈$1.7B/year cash flow profile from roughly $27B of contracted revenue as the business mix shifts.
- Strong Revenue Growth and Margin ExpansionRevenue increased ~81% year-over-year to $74.9 million. Gross profit was approximately $48 million and gross margin expanded to ~64% (from ~47% prior year). Adjusted EBITDA (ex digital asset mark-to-market) was $10.4 million versus $4.2 million in the prior year period.
- Compute Segment Operating LeverageCompute revenue rose to $72.5 million from $34.3 million, driven by bitcoin mined increasing from ~308 to ~935. Compute segment gross margin was ~66%, demonstrating operating leverage from additional operating capacity (Vega, re-energized Drumheller).
- Major Investment-Grade Project FinancingsClosed ~$7.5 billion of nonrecourse, senior secured, fully amortizing project-level financings for River Bend (~$3.25B) and Beacon Point (~$4.25B). Financing was investment-grade rated, oversubscribed, and structured to remove project refinancing risk—creating a repeatable capital formation template.
- Large Contracted AI Data Center BookingsBeacon Point Building 2 lease: 352 MW IT capacity (~$9.8 billion expected base-term contract value). Beacon Point campus now ~704 MW contracted (~$19.6B expected base-term value). Together with River Bend, total contracted AI data center capacity is ~949 MW representing ~ $26.6 billion of expected aggregate base-term contract value.
- Substantial Restricted Liquidity to Fund ConstructionCash and restricted cash increased to ~ $7.0 billion total (unrestricted cash approx $233.6 million; restricted cash approx $6.8 billion) held in project accounts for construction and debt service—ensuring funded construction for financed campuses. Undrawn construction proceeds generated $27.1 million of interest income in the quarter.
- Development Pipeline Growth and QualityReported development pipeline stands at ~8.7 GW, up ~300 MW from last quarter. 11 sites are in diligence/exclusivity averaging >650 MW each; exclusivity stage increased by ~200 MW. Reported pipeline excludes behind-the-meter and certain M&A opportunities (conservative disclosure approach).
- Cleaner Parent Balance Sheet and Parent Liability ReductionCoatue converted ~$159.3 million of principal into ~9.7 million shares, eliminating remaining parent recourse debt. A $200M Coinbase facility was refinanced with a FalconX term loan at a lower coupon (9% -> 7%) collateralized by bitcoin, simplifying parent obligations.
DE:V71 Earnings History
| Report Date | Fiscal Quarter | Forecast / EPS | Last Year's EPS | EPS YoY Change | Press Release |
|---|---|---|---|---|---|
| Nov 04, 2026 | 2026 (Q3) | -0.65- | 0.39 | ― | ― |
| Aug 04, 2026 | 2026 (Q2) | -0.49-1.14 | 1.06 | -207.63% (-2.20) | |
| May 06, 2026 | 2026 (Q1) | -0.30-1.78 | -1.17 | -52.31% (-0.61) | |
| Feb 25, 2026 | 2025 (Q4) | -0.06-2.18 | 1.35 | -261.67% (-3.53) | |
| Nov 04, 2025 | 2025 (Q3) | -0.110.39 | 0.01 | 4200.00% (+0.38) | |
| Aug 07, 2025 | 2025 (Q2) | 1.061.06 | -0.7 | 251.28% (+1.76) | |
| May 08, 2025 | 2025 (Q1) | -0.09-1.17 | 2.48 | -147.10% (-3.65) | |
| Mar 03, 2025 | 2024 (Q4) | 0.031.35 | -2.94 | 145.87% (+4.29) | |
| Nov 13, 2024 | 2024 (Q3) | -0.260.01 | -0.4 | 102.22% (+0.41) | |
| Aug 13, 2024 | 2024 (Q2) | -0.03-0.70 | -1.73 | 59.42% (+1.03) |
The table shows recent earnings report dates and whether the forecast was beat or missed. See the change in forecast and EPS from the previous year.