

Range Resources (RAX) Q2 2026 Earnings Report
DE:RAX Q2 2026 EPS Results
- Actual EPS
- EUR 0.71
- Consensus EPS
- EUR 0.59
- Beat/Miss
- Beat by +EUR 0.12
- One Year Ago EPS
- EUR 0.59
DE:RAX Q2 2026 Revenue Results
- Actual Revenue
- EUR 680.51M
- Expected Revenue
- EUR 666.87M
- Beat/Miss
- Beat by +EUR 13.64M
- YoY Revenue Growth
- +8.34%
Earnings Announcement Details
- Quarter
- Q2 2026
- Date
- 07/21/2026
- Time
- After Close
- Conference Call
- Tuesday, July 21, 2026
Range Resources's next earnings date is estimated for March 2, 2027, based on past reporting schedules.
Q2 2026 Earnings Call Audio
Q2 2026 Earnings Slide Deck
Q2 2026 Earnings Call Summary
The call emphasizes strong operational execution, record completion/drilling efficiencies, robust export-driven marketing results (notably NGL premiums and rising LNG feed gas), disciplined capital sequencing, and meaningful shareholder returns and balance sheet improvements. Near-term headwinds include a softer front-month gas curve, continued sub-investment grade credit rating, and modest drilling resequencing into 2027, but management presents clear plans to capture export demand, maintain guidance, and convert inventory optionality into long-term growth and free cash flow.
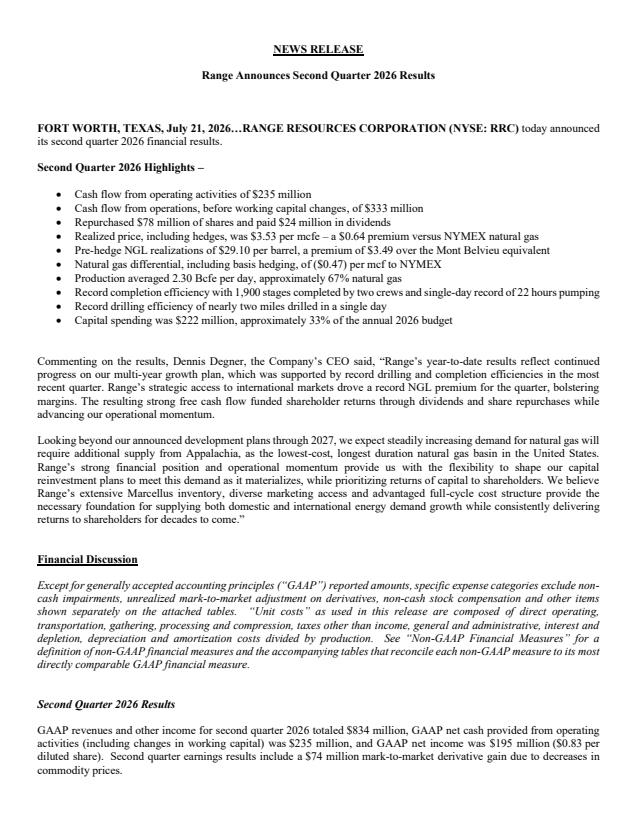
Range reiterated that production will ratably rise from 2.3 BCFe/d in Q2 to ~2.4 BCFe/d in Q3 and to 2.5 BCFe/d by year‑end 2026, with a multi‑year plan to reach ~2.6 BCFe/d in 2027 (≈20% growth), funded with similar capital pacing (Q2 CapEx $222M; company estimates sustaining 2.6 BCFe/d for < $600M annual D&C, or ~ $0.60/MCFE). Processing and related infrastructure commissioning in H2 should underpin the ramp, and Range improved commodity guidance—full‑year NGL premium to $2.50/bbl over Mont Belvieu (Q2 realized $3.49/bbl) and natural gas basis to $0.35–$0.40/Mcf versus Henry Hub. Operational sequencing shifts include drilling ~190,000 lateral feet in Q2, two frac crews completing ~1,900 stages (≳10 stages/day/crew; base contracted electric fleet ~14 stages/day), a single‑crew annualized rate >750,000 lateral feet, ~400,000 lateral feet of DUCs to be worked through in 2026–27, and average laterals of ~12–15k ft (some to 18–20k+). Financially Range returned capital of $105M in buybacks and $47M in dividends YTD (Q2 buybacks $78M, Q2 dividends $24M), reduced debt by $337M YTD, repurchased 35.9M shares (~10% fewer outstanding), and illustrated >$2.5B of free cash flow over three years at a $3.75 mid‑cycle gas price.
- Production Growth and GuidanceQ2 production of 2.3 BCFe/d; on-track guidance to 2.4 BCFE/d in Q3 and 2.5 BCFE/d by year-end; multi-year plan target of ~2.6 BCFE/d in 2027 (~20% growth from plan announcement).
- Record Operational EfficiencyDrilled ~190,000 lateral feet in Q2; 19 days with >1 mile drilled, including a 24-hour period >10,500 feet; best quarterly completions in company history (~1,900 frac stages combined for two crews), averaging >10 stages/day/crew and ~14 stages/day for base electric frac fleet; single-crew record of 20 frac stages/day and 22 pumping hours/day.
- Completion Throughput and ProductivityTwo frac crews achieved an annualized single-crew rate equivalent of >750,000 lateral feet (based on quarter performance); management cites peer-leading drilling and completion cost per foot after decades of activity.
- Capital Execution and SequencingQ2 capital spending of $222 million; added a second completion crew and a spot horizontal rig for a single pad; plan to return to one rig/one frac crew by Q4 while maintaining previously communicated 2026/2027 capital guidance (only sequencing shifted).
- Strong NGL and Export Marketing ResultsCaptured an NGL premium of $3.49/bbl over Mont Belvieu in Q2 and raised full-year NGL premium guidance to $2.50/bbl over Mont Belvieu; US waterborne ethane exports averaged 658,000 bpd in Q2 (+40% YoY) with a June record ~750,000 bpd; propane+butane exports >2.6 million bpd (+30% YoY, +19% vs Q1).
- Natural Gas Export MomentumUS LNG feed gas averaged >17 BCF/d in Q2, a 17% increase year-over-year; management expects continued export-driven demand growth into 2027 and beyond.
- Shareholder Returns and Balance Sheet ImprovementsRepurchased $78 million of shares in Q2 ($105 million YTD); paid $24 million dividends in Q2 ($47 million YTD); reduced debt by $337 million YTD; enterprise value returned to equity holders YTD $489 million (~5.5% of market cap); since repurchase program start acquired 35.9 million shares (~10% reduction in share count).
- Attractive Cash Flow PotentialCFO illustration: exiting growth plan at 2.6 BCF/d with a $3.75 mid-cycle gas price would generate >$2.5 billion free cash flow over three years (~30% of current market cap), sufficient to repay debt and repurchase significant shares.
- Long-Term Inventory and Low Capital IntensityMarcellus inventory cited as 30+ years; management expects to sustain multi-decade production with relatively low capital intensity (estimate: maintain 2.6 BCFE/d for <$600M annual D&C capital, ~ $0.60 per MCFE).
- GP&T and Infrastructure PositioningGathering declines have helped offset pipeline tariff inflation, keeping GP&T relatively stable; commissioning of gas processing/infrastructure underway and Repauno dock capacity expected to support east-coast NGL exports in 2027, supporting premium capture.
DE:RAX Earnings History
| Report Date | Fiscal Quarter | Forecast / EPS | Last Year's EPS | EPS YoY Change | Press Release |
|---|---|---|---|---|---|
| Mar 02, 2027 | 2026 (Q4) | 0.96- | 0.73 | ― | ― |
| Oct 27, 2026 | 2026 (Q3) | 0.670.73 | 0.51 | 42.11% (+0.21) | |
| Jul 21, 2026 | 2026 (Q2) | 0.590.71 | 0.59 | 19.70% (+0.12) | |
| Apr 21, 2026 | 2026 (Q1) | 1.191.36 | 0.86 | 58.33% (+0.50) | |
| Feb 24, 2026 | 2025 (Q4) | 0.640.73 | 0.61 | 20.59% (+0.13) | |
| Oct 28, 2025 | 2025 (Q3) | 0.470.51 | 0.43 | 18.75% (+0.08) | |
| Jul 22, 2025 | 2025 (Q2) | 0.570.59 | 0.41 | 43.48% (+0.18) | |
| Apr 22, 2025 | 2025 (Q1) | 0.820.86 | 0.62 | 39.13% (+0.24) | |
| Feb 25, 2025 | 2024 (Q4) | 0.540.61 | 0.56 | 7.94% (+0.04) | |
| Oct 22, 2024 | 2024 (Q3) | 0.330.43 | 0.41 | 4.35% (+0.02) |
The table shows recent earnings report dates and whether the forecast was beat or missed. See the change in forecast and EPS from the previous year.
