

National Bank of Canada (NBC) Q3 2026 Earnings Report
DE:NBC Q3 2026 EPS Results
- Actual EPS
- EUR 2.17
- Consensus EPS
- EUR 2.05
- Beat/Miss
- Beat by +EUR 0.12
- One Year Ago EPS
- EUR 1.72
DE:NBC Q3 2026 Revenue Results
- Actual Revenue
- EUR 5.38B
- Expected Revenue
- EUR 2.47B
- Beat/Miss
- Beat by +EUR 2.91B
- YoY Revenue Growth
- +10.61%
Earnings Announcement Details
- Quarter
- Q3 2026
- Date
- 08/26/2026
- Time
- Before Open
- Conference Call
- Wednesday, August 26, 2026
National Bank of Canada's next earnings date is estimated for December 4, 2026, based on past reporting schedules.
Q3 2026 Earnings Call Audio
Q3 2026 Earnings Slide Deck
Q3 2026 Earnings Call Summary
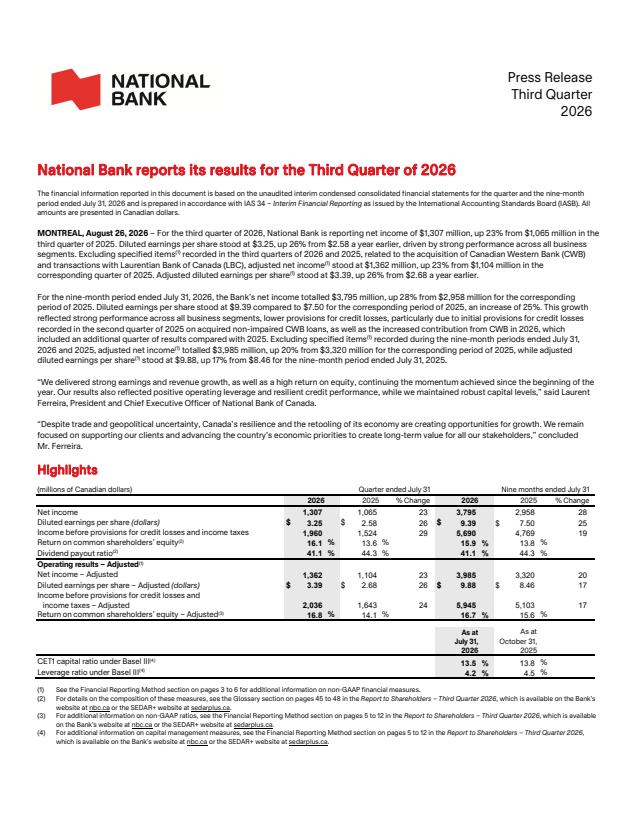
The call presented strong core operating momentum: double-digit revenue growth, substantial EPS upside (+26% YoY), robust segment performances (capital markets and wealth), healthy loan/deposit growth, positive operating leverage, meaningful synergy capture from the CWB acquisition, and a solid capital and provisioning position. Offsetting items include margin pressure in personal & commercial banking (driven by rapid mortgage growth and deposit mix), above-trend expense growth (variable compensation and investments), a deferred and moderated AIRB capital benefit, and some isolated credit lumpiness (notably an oil & gas provision). On balance, the positives significantly outweigh the challenges, though key execution areas to watch include margin management, expense control, and the successful completion of the AIRB transition.
Guidance highlights: management expects Q4 P&C margin to remain roughly at Q3 levels (P&C margin down 7 bps q/q in Q3) and all‑bank NIM to be relatively stable in Q4 (all‑bank NIM 2.18%, +2 bps q/q; NII excluding trading +7% q/q), with positive operating leverage for the full year and expense growth moderating in Q4 (PTPP +24% y/y, operating leverage 5.8%; expenses +11.7% y/y, ex‑variable comp/litigation +7.7%). Credit guidance for fiscal 2026 remains impaired provisions of 25–35 bps (Q3 total PCL $240M / 31 bps; PCL on impaired loans $224M / 28 bps; performing provision +3 bps in Q3); allowances totaled $2.7B (5.3x net charge‑offs) with performing allowances $1.7B (2x). Capital and capital‑deployment guidance: CET1 was 13.51% (capital generation +41 bps in Q3; RWA expansion −19 bps; organic RWA growth consumed 35 bps; refinements +15 bps; Q3 repurchases 2.3M shares reduced CET1 by 26 bps), with ~20 bps of additional CET1 expected from refinements in Q4‑26, AIRB benefits now expected to materialize late‑2027 toward the lower end of the prior 35–55 bps range, a new NCIB to be launched on expiry in Sept‑26, and a CET1 convergence target of ~13% by end‑2027; the bank remains on track to exceed its 16% FY26 ROE target (YTD ROE 16.7%, YTD EPS +16.8%) and to achieve 17%+ ROE by 2027. Operationally, CWB synergies of $238M have been realized to date (on track to $270M by end‑26, ~ $300M annualized) with $52M of revenue synergies already captured and a $200–250M revenue synergy target by end‑28; dividend payout is currently 38.8% and will be reviewed next quarter.
- Strong EPS and Revenue GrowthEPS of $3.39 in Q3 FY26, up 26% year-over-year; Revenues increased 18% year-over-year, driven by fee-based businesses and balance sheet growth.
- Robust Profitability and Operating LeverageReturn on equity (ROE) of 16.8% in Q3 and year-to-date ROE of 16.7%; positive operating leverage of ~5.8% (nearly 6%) and management on track to exceed 16% ROE for FY26.
- Segment Outperformance — Capital Markets and WealthCapital Markets net income $442 million, up 32% year-over-year (global markets revenue $578 million); Wealth Management net income $299 million, up 22% year-over-year; Corporate & Investment Banking revenue +13% YoY and corporate banking loans +13% YoY.
- Loan and Deposit GrowthTotal loans increased 11% year-over-year and 4% quarter-over-quarter (record mortgage originations); personal mortgages grew 14% YoY; deposits up 11% YoY (1% sequentially).
- Solid Capital Position and Shareholder ReturnsCET1 ratio of 13.51%; capital generation of 41 basis points in the quarter; repurchased 2.3 million shares in Q3 and intend to complete current NCIB and launch a new NCIB (subject to approvals); dividend payout ratio ~38.8%.
- Synergy Realization from CWB AcquisitionCaptured $238 million of cost and funding synergies to date; on track to reach $270 million by end of FY26 (~$300 million annualized); achieved fiscal 26 revenue synergy target early ($52 million realized vs $50 million target).
- Prudent Credit Performance and AllowancesTotal provision for credit losses (PCL) $240 million or 31 bps (stable QoQ) and within FY26 guidance range; impaired PCL $224 million or 28 bps; total allowances $2.7 billion representing 5.3x coverage of net charge-offs and performing allowances coverage ~2.0x.
- Stable Net Interest Income and NIM ContributionNet interest income excluding trading increased ~7% sequentially; all-bank NIM increased 2 basis points QoQ to 2.18%, aided by Treasury contributions (+3 bps) and reclassification effects (+4 bps).
DE:NBC Earnings History
| Report Date | Fiscal Quarter | Forecast / EPS | Last Year's EPS | EPS YoY Change | Press Release |
|---|---|---|---|---|---|
| Dec 04, 2026 | 2026 (Q4) | 2.10- | 1.81 | ― | ― |
| Aug 26, 2026 | 2026 (Q3) | 2.052.17 | 1.72 | 26.49% (+0.45) | |
| May 27, 2026 | 2026 (Q2) | 2.002.07 | 1.83 | 13.33% (+0.24) | |
| Feb 25, 2026 | 2026 (Q1) | 1.922.08 | 1.88 | 10.92% (+0.21) | |
| Dec 03, 2025 | 2025 (Q4) | 1.681.81 | 1.65 | 9.30% (+0.15) | |
| Aug 27, 2025 | 2025 (Q3) | 1.741.72 | 1.72 | 0.00% (+0.00) | |
| May 28, 2025 | 2025 (Q2) | 1.541.83 | 1.63 | 12.20% (+0.20) | |
| Feb 26, 2025 | 2025 (Q1) | 1.701.88 | 1.66 | 13.13% (+0.22) | |
| Dec 04, 2024 | 2024 (Q4) | 1.651.65 | 1.56 | 5.74% (+0.09) | |
| Aug 28, 2024 | 2024 (Q3) | 1.581.72 | 1.42 | 21.27% (+0.30) |
The table shows recent earnings report dates and whether the forecast was beat or missed. See the change in forecast and EPS from the previous year.
