


Marcus & Millichap earnings date
Marcus & Millichap (M6M) Q3 2026 Earnings Report
DE:M6M Q3 2026 EPS Results
- Actual EPS
- EUR 0.03
- Consensus EPS
- EUR 0.06
- Beat/Miss
- Missed by -EUR 0.03
- One Year Ago EPS
- EUR 0.01
DE:M6M Q3 2026 Revenue Results
- Actual Revenue
- EUR 186.56M
- Expected Revenue
- EUR 183.59M
- Beat/Miss
- Beat by +EUR 2.97M
- YoY Revenue Growth
- +7.47%
Earnings Announcement Details
- Quarter
- Q3 2026
- Date
- 11/06/2026
- Time
- Before Open
- Conference Call
- Friday, November 6, 2026
Marcus & Millichap's next earnings date is estimated for February 12, 2027, based on past reporting schedules.
Q3 2026 Earnings Call Audio
Q3 2026 Earnings Slide Deck
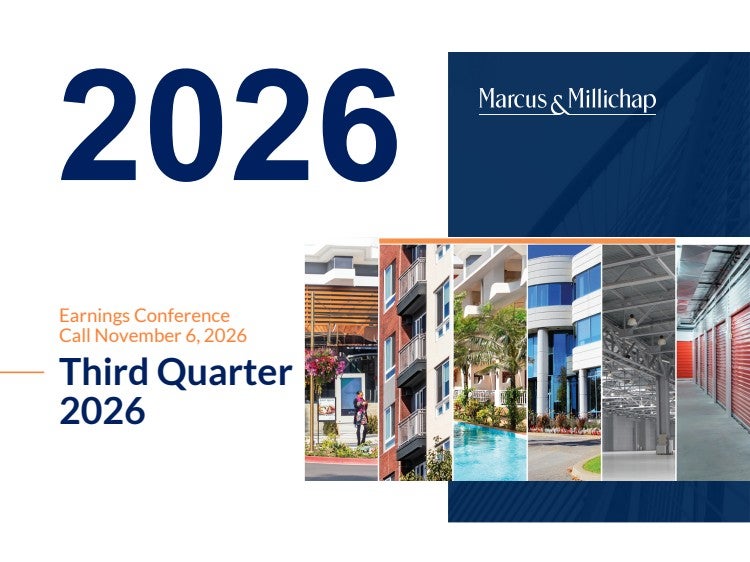
Q3 2026 Earnings Call Summary
The call was broadly constructive, with revenue, brokerage volume, profitability, cash generation, and year-to-date results improving meaningfully. Management also highlighted favorable financing availability, increasing seller motivation, near-record inventory, and multiple long-term growth initiatives. These positives were partly offset by persistent interest-rate volatility, bid-ask spread challenges, slower transaction execution, elevated new-agent turnover, higher strategic investment spending, and measured near-term expectations.
Management anticipates quarter-over-quarter sequential revenue growth in the fourth quarter due to usual year-end seasonality but remains measured in near-term expectations because of interest rate volatility and uncertainty; cost of services as a percentage of revenue is expected to be sequentially higher than Q3, SG&A on a dollar basis is expected to be comparable to the third quarter, and the income tax rate should be in the range of 45% to 50%. Strategic initiatives are expected to represent incremental spend of approximately 1% to 2% of revenue over the next 18 to 24 months, while growth initiatives will moderately increase costs over the next 18 to 24 months; the company does not expect a meaningful revenue contribution from leasing in 2027, plans to upgrade enterprise systems and implement AI-enabled tools over the next 12 to 18 months, and expects more transaction activity tied to $1.2 trillion of loan maturities expected in 2027 and 2028, with multifamily and retail loan maturities accounting for nearly 50% of the total volume over the next 2 years.
- Revenue Growth in the Third Quarter and Year to DateTotal third-quarter revenue increased 7.5% to $208 million, while year-to-date revenue reached $583 million, up 14% from $511 million a year ago.
- Brokerage Revenue and Transaction Volume GrowthBrokerage revenue increased 7% to $174 million in the third quarter. The company completed 1,584 brokerage transactions, essentially flat year over year, while total transaction volume increased 13% to $9.4 billion.
- Strong Middle Market and Larger Transaction PerformanceMiddle Market revenue grew 17% to $31 million, and the larger transaction segment covering deals above $20 million grew 20% to $31 million, led by increased transaction volume and a shift toward larger transactions.
- Private Client Revenue Growth Despite a Difficult ComparisonPrivate Client revenue increased 4% year over year to $106 million, despite higher interest rates and comparison with a 17% gain in the third quarter of 2025.
- Financing and Other Revenue GrowthThird-quarter financing revenue increased 3% to $27 million, following a 28% year-over-year increase in the prior-year quarter. Year-to-date financing revenue rose 19% to $84 million. Other revenue increased to $7 million from $5 million, while year-to-date other revenue rose to $19 million from $13 million.
- Improved Profitability and Adjusted EBITDAAdjusted EBITDA increased 20% in the third quarter to $8.2 million from $6.9 million. Year-to-date adjusted EBITDA reached $23.3 million, compared with a $400,000 loss in the first nine months of 2025. Year-to-date earnings were $0.05 per share versus a $0.39 per-share loss a year ago.
- Improved Net Income and Effective Tax RateThird-quarter net income increased to $1 million, or $0.03 per share, from $240,000, or $0.01 per share, in the prior-year quarter. The effective tax rate declined to approximately 61% from approximately 84%.
- Favorable Financing AvailabilityManagement said financing availability and lenders' appetite to compete and put capital to work remain favorable, although underwriting and borrower qualification are subject to elevated caution.
- Increasing Seller Motivation and Market RepricingManagement reported that significant real estate repricing has occurred, with further adjustments underway. More sellers are listing properties at realistic prices and showing greater willingness to transact as expectations for interest rates to return to prior levels have faded.
- Expected Transaction Opportunity from Loan Maturities and DistressSituational distress, weak operations, lower-than-expected rent growth, and $1.2 trillion of expected loan maturities in 2027 and 2028 were cited as potential drivers of higher transaction activity. Multifamily and retail maturities are expected to represent nearly 50% of total volume over the next two years.
- Near-Record Inventory and Available Transaction CapitalManagement said the company has near-record inventory going into 2027 and is very confident that inventory within a 10% or 15% price range is sellable. It also said there is plenty of capital on the sidelines seeking to transact and that deals are generally being delayed or repriced rather than fundamentally abandoned.
- Expansion of Core PlatformsThe company plans to expand its market-leading Private Client platform, build out the IPA platform, grow MMCC financing capabilities, recruit leading loan originators, and target boutique mortgage banking firms for acquisitions.
- Auction and Leasing ExpansionThe auction division added specialists in strategic regions to increase collaboration with the sales force and generate incremental business. The company is also scaling leasing capabilities, prioritizing retail leasing and pursuing a buy-and-build approach through boutique acquisitions and experienced team recruitment.
- Technology and AI InvestmentOver the next 12 to 18 months, MMI plans to upgrade enterprise systems and implement AI-enabled tools, including proprietary tools, enhancements to legacy technology, and commercial systems integrated into the MMI ecosystem.
- Strong Balance Sheet and Shareholder ReturnsThe company ended the quarter with $373 million in cash, cash equivalents, and marketable securities, had no debt, and generated operating cash. Since launching its capital allocation plan in 2022, it has returned $132 million through dividends and $120 million through share repurchases.
- Strategic Capital Allocation FlexibilityManagement said it is maintaining capital allocation flexibility for potential opportunities, including internal technology investments and potential mergers and acquisitions in brokerage, financing, and other areas.
DE:M6M Earnings History
| Report Date | Fiscal Quarter | Forecast / EPS | Last Year's EPS | EPS YoY Change | Press Release |
|---|---|---|---|---|---|
| Feb 12, 2027 | 2026 (Q4) | 0.29- | 0.3 | ― | ― |
| Nov 06, 2026 | 2026 (Q3) | 0.060.03 | 0.01 | 200.00% (+0.02) | |
| Aug 06, 2026 | 2026 (Q2) | 0.030.09 | -0.25 | 135.71% (+0.34) | |
| May 07, 2026 | 2026 (Q1) | -0.07-0.07 | -0.1 | 27.27% (+0.03) | |
| Feb 13, 2026 | 2025 (Q4) | 0.190.30 | 0.2 | 54.55% (+0.11) | |
| Nov 07, 2025 | 2025 (Q3) | 0.000.01 | -0.13 | 107.14% (+0.13) | |
| Aug 07, 2025 | 2025 (Q2) | -0.09-0.25 | -0.13 | -100.00% (-0.13) | |
| May 07, 2025 | 2025 (Q1) | -0.14-0.10 | -0.23 | 57.69% (+0.13) | |
| Feb 14, 2025 | 2024 (Q4) | -0.020.20 | -0.24 | 181.48% (+0.44) | |
| Nov 08, 2024 | 2024 (Q3) | -0.17-0.13 | -0.21 | 41.67% (+0.09) |
The table shows recent earnings report dates and whether the forecast was beat or missed. See the change in forecast and EPS from the previous year.
