

MSA Safety (M07) Q2 2026 Earnings Report
DE:M07 Q2 2026 EPS Results
- Actual EPS
- EUR 2.15
- Consensus EPS
- EUR 1.91
- Beat/Miss
- Beat by +EUR 0.24
- One Year Ago EPS
- EUR 1.73
DE:M07 Q2 2026 Revenue Results
- Actual Revenue
- EUR 450.03M
- Expected Revenue
- EUR 443.72M
- Beat/Miss
- Beat by +EUR 6.31M
- YoY Revenue Growth
- +6.16%
Earnings Announcement Details
- Quarter
- Q2 2026
- Date
- 07/30/2026
- Time
- After Close
- Conference Call
- Thursday, July 30, 2026
MSA Safety's next earnings date is estimated for February 17, 2027, based on past reporting schedules.
Q2 2026 Earnings Call Audio
Q2 2026 Earnings Slide Deck
Q2 2026 Earnings Call Summary
The call conveyed solid financial performance: double-digit margin expansion, strong EPS growth, robust free cash flow and successful M&A execution, alongside clear product and technology momentum (MSA+ adoption and industrial PPE strength). Offsetting this were notable regional headwinds—chiefly the Middle East conflict—timing delays in fire-service AFG orders, some non-recurring tariff benefit to margins, and supply-chain/input-cost pressures that are expected to temper gross margins in H2. Management maintained a positive outlook (low-double-digit total revenue growth for 2026 with mid-single-digit organic growth) while signaling disciplined capital allocation and a target leverage range.
MSA guided to low-double-digit total revenue growth for 2026, driven by mid-single-digit organic growth, a mid-single-digit contribution from acquisitions and 1–2 points of favorable translational FX, reiterated mid-single-digit organic guidance, and expects full-year adjusted gross margin of 47.5%–48.5% (with a moderate H2 tempering as higher-cost inventory from the Middle East flows through over 90–120 days); interest expense is modeled at $40–43 million, tax rate and pension income are unchanged, and the company will prioritize debt repayment while continuing share repurchases at a lower H2 pace; pro forma net leverage post‑Autronica is ~1.8x (Q2 adjusted net leverage was 0.8x, net debt down $33M sequentially), liquidity was $1.2B at quarter end ($600M pro forma), weighted average interest rate was 3.8%, first‑half returns to shareholders were $118M (Q2 $47M), first‑half free cash flow conversion was 94%, the quarter included a ~$4M tariff refund (~100 bps benefit), and going forward M&C and MSA+ contributions are reflected in organic results.
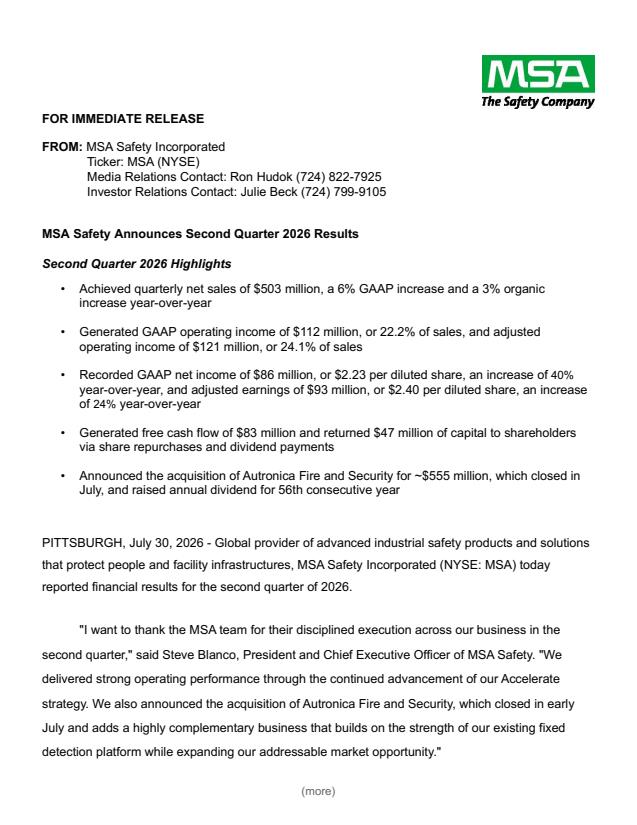
- Revenue GrowthSecond quarter sales of $503 million, up 6% on a reported basis and up 3% organically year-over-year; currency translation provided a ~2 percentage-point tailwind and M&C contributed ~1 percentage-point.
- Earnings and Margin ExpansionAdjusted EPS of $2.40, up 24% versus prior year; GAAP diluted EPS $2.23, up 40%. GAAP gross margin of 49.5% (up ~290 basis points year-over-year and +210 bps sequentially). Adjusted operating margin of 24.1%, up ~270 bps year-over-year.
- Strong Free Cash Flow and Capital ReturnsGenerated $83 million of free cash flow in the quarter (96% of earnings) and first-half free cash flow conversion of 94%; returned $47 million to shareholders in Q2 and $118 million in the first half (a 45% increase versus prior year).
- Acquisition and M&A ActivityCompleted acquisition of Autronica Fire & Security in early July; M&A pipeline described as robust and management remains active while targeting a net leverage sweet spot of 1.5x–2.5x.
- Product and Technology MomentumMSA+ connected solutions represented >50% of portable gas detection growth and now account for 14% of total portable sales (up from 10% a year ago); early customer feedback for ALTAIR io 6 is positive and adoption accelerating.
- Industrial PPE StrengthOrganic industrial PPE sales increased 16% year-over-year, driven by strong demand across core industrial markets and OEM/product adoption (e.g., H2 type 2 safety helmet adoption in Americas).
- Healthy Balance Sheet MetricsQuarter-end liquidity of $1.2 billion (pro forma post-Autronica ~$600 million), net debt decreased sequentially, adjusted net leverage 0.8x (pro forma 1.8x after acquisition) and weighted average interest rate ~3.8%.
DE:M07 Earnings History
| Report Date | Fiscal Quarter | Forecast / EPS | Last Year's EPS | EPS YoY Change | Press Release |
|---|---|---|---|---|---|
| Feb 17, 2027 | 2026 (Q4) | 2.33- | 2.13 | ― | ― |
| Nov 02, 2026 | 2026 (Q3) | 1.871.87 | 1.73 | 7.73% (+0.13) | |
| Jul 30, 2026 | 2026 (Q2) | 1.912.15 | 1.73 | 24.35% (+0.42) | |
| May 04, 2026 | 2026 (Q1) | 1.631.78 | 1.5 | 18.45% (+0.28) | |
| Feb 11, 2026 | 2025 (Q4) | 2.022.13 | 2.01 | 5.78% (+0.12) | |
| Oct 28, 2025 | 2025 (Q3) | 1.671.73 | 1.64 | 6.01% (+0.10) | |
| Aug 04, 2025 | 2025 (Q2) | 1.571.73 | 1.8 | -3.98% (-0.07) | |
| Apr 29, 2025 | 2025 (Q1) | 1.411.50 | 1.44 | 4.35% (+0.06) | |
| Feb 12, 2025 | 2024 (Q4) | 2.002.01 | 1.84 | 9.22% (+0.17) | |
| Oct 23, 2024 | 2024 (Q3) | 1.611.64 | 1.59 | 2.81% (+0.04) |
The table shows recent earnings report dates and whether the forecast was beat or missed. See the change in forecast and EPS from the previous year.
