


Louisiana-Pacific earnings date
Louisiana-Pacific (LP3) Q3 2026 Earnings Report
DE:LP3 Q3 2026 EPS Results
- Actual EPS
- EUR 0.35
- Consensus EPS
- EUR 0.19
- Beat/Miss
- Beat by +EUR 0.16
- One Year Ago EPS
- EUR 0.32
DE:LP3 Q3 2026 Revenue Results
- Actual Revenue
- EUR 618.69M
- Expected Revenue
- EUR 601.02M
- Beat/Miss
- Beat by +EUR 17.66M
- YoY Revenue Growth
- +4.22%
Earnings Announcement Details
- Quarter
- Q3 2026
- Date
- 11/03/2026
- Time
- Before Open
- Conference Call
- Tuesday, November 3, 2026
Louisiana-Pacific's next earnings date is estimated for February 23, 2027, based on past reporting schedules.
Q3 2026 Earnings Call Audio
Q3 2026 Earnings Slide Deck
Q3 2026 Earnings Call Summary
The call was overall constructive. LP reported a return to siding growth, record siding sales, strong safety performance, improved full-year guidance, positive distributor sell-through trends, and a long-term distribution and enterprise-partnership strategy. These positives were tempered by raw material and freight inflation, a challenging housing environment, OSB losses and mill curtailments, and near-term complexity from the distribution transition.
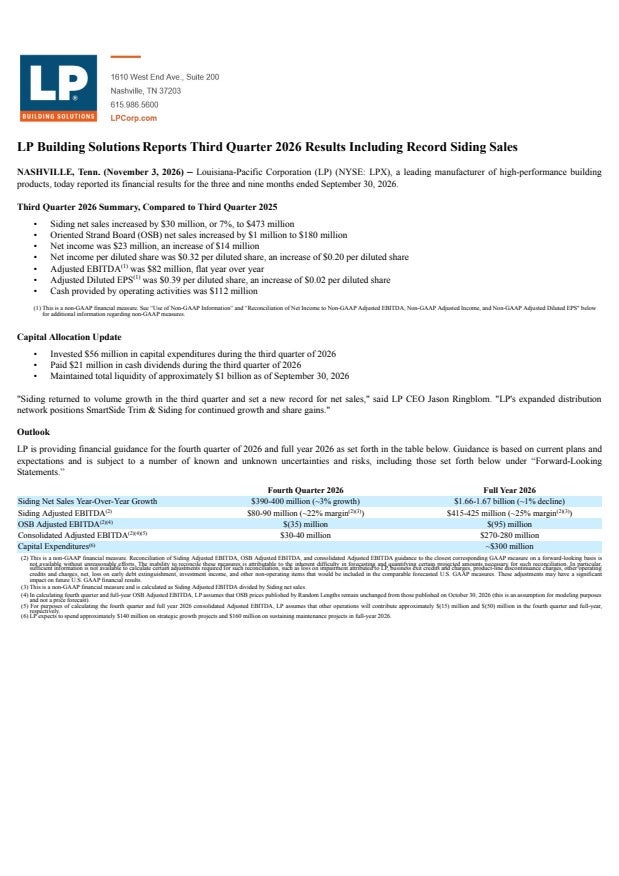
For the fourth quarter, LP expects Siding volume growth to continue, with roughly 3% growth mostly price with some negative mix effect, Siding revenue in the range of $390 million to $400 million and Siding EBITDA in the range of 80 million to $90 million; for the full year, Siding revenue is expected to land between $1.66 billion and $1.67 billion, down about 1% compared to prior year, Siding EBITDA between $415 million and $425 million, OSB to lose about $35 million in EBITDA in the fourth quarter assuming prices remain flat through year end, OSB full year EBITDA to be about a $95 million loss, and full year EBITDA for LP to be between $270 million and $280 million. LP is not providing guidance for 2027 yet, but anticipates netting roughly 3.5% to 4% on a similar mix to 2026, with shipments at the new prices expected sometime in early to mid January.
- Siding Returned to Year-Over-Year GrowthSiding volume grew 2% and net sales increased 7% in the third quarter, setting a new record for siding net sales and exceeding the high end of guidance. Growth was achieved despite a 2% decline in single-family housing starts.
- Strong Siding Revenue and EBITDASiding generated record net sales of $473 million, above the top end of guidance, and EBITDA of $119 million, just below the top of the guided range. The resulting adjusted EBITDA margin was just over 25%.
- Siding Price and Volume ContributionsAverage siding selling prices increased 5% year over year, primarily due to list price increases. Higher volumes added $8 million of revenue and $4 million of EBITDA, consistent with historical incremental EBITDA margins for volume.
- Expert Finish Revenue MixExpert Finish represented 10% of siding volume and 16% of siding revenue in the quarter.
- Siding Distribution Network TransformationLP significantly expanded and simplified its siding distribution network, adding nationwide coverage through Specialty Building Products and other partners, including new partners Forest Products Supply Company and Palmer Donovan. The distributors will carry the full line of SmartSide products, including Expert Finish and the Naturals collection.
- Positive Distributor Sell-Through TrendsExpert Finish sell-through rates were up 8% versus the prior-year quarter and 13% versus the second quarter. Prime SmartSide sell-through rates were comparable to the prior year, while channel inventories for both Prime SmartSide and Expert Finish were down versus the prior quarter and prior year.
- Taylor Morrison Strategic Vendor RecognitionTaylor Morrison named LP its new strategic vendor of the year. LP said its enterprise programs are leveraging the breadth of its portfolio, including SmartSide and OSB, to expand access to markets where it has historically been underpenetrated.
- Expected 2027 Pricing and Price-Cost ImprovementLP is anticipating a net price increase of roughly 3.5% to 4% in 2027 on a similar mix to 2026, with Prime SmartSide expected to be slightly higher than Expert Finish. The new prices are expected to begin shipping in early to mid-January, and management said siding should be healthily price-cost positive next year under anything but very negative changes in raw materials.
- Fourth-Quarter Siding Growth OutlookLP expects approximately 3% fourth-quarter siding growth, mostly from price with some negative mix effect, and projects fourth-quarter siding revenue of $390 million to $400 million and EBITDA of $80 million to $90 million.
- Improved Full-Year GuidanceLP increased the lower bounds of its full-year revenue and EBITDA ranges. Full-year siding revenue is expected to be $1.66 billion to $1.67 billion, full-year siding EBITDA is expected to be $415 million to $425 million, and total LP EBITDA is expected to be $270 million to $280 million.
- Cash Flow, Capital Investment, and LiquidityLP generated $112 million of operating cash flow, invested $56 million in capital expenditures to maintain assets and support growing demand for SmartSide and Expert Finish, returned $21 million to shareholders through dividends, and ended the quarter with $265 million in cash and just over $1 billion in liquidity.
- Strong Safety Performance and RecognitionLP received the Engineered Wood Association's safest company award for the fourth consecutive year and achieved a total incident rate of 0.4 in the third quarter. Its Expert Finish facility in Roaring River, North Carolina reached 1 million work hours without a recordable incident.
- Workplace and Sustainability RecognitionLP was recognized by Newsweek as one of America's Greatest Companies, based on financial performance, innovation, workplace culture, and environmental sustainability.
- OSB Volume Growth and Inventory Valuation BenefitOSB volumes increased 7% in the quarter. Inventory valuation adjustments contributed $14 million of EBITDA benefit, while operational excellence and cost discipline contributed another $3 million in SG&A and other savings.
- OSB Pricing Expected to Improve in Q4OSB average selling prices climbed in September, and LP expects higher realizations in the fourth quarter because of the timing of late-quarter price increases and the typical lag as prices move through the business.
- Shed Segment ReboundAfter a difficult start to the year and inventory rebalancing by distribution partners, shed sell-through rebounded during the second half of the year. LP said it is focused on increasing its share of wallet with shed fabricators across flooring, roofing, and trim.
- Enterprise Partnership PipelineLP said it is working on several programs with large builders and manufactured housing producers during the current RFP season. Management said the programs are progressing nicely and that the bundling of LP's portfolio is resonating with customers through installation efficiencies, durability, and quality.
- Long-Term Distribution BenefitsLP's new distribution footprint includes more than 100 locations and 12 or 13 partners, with a field sales organization larger than LP's own. Management expects greater geographic reach, exclusivity, alignment around strategy, and improved execution over the long term.
- OSB Capacity Management PositionAfter operating at roughly 75% network utilization before the Jasper and Maniwaki actions, LP said it has optimized its network to position the OSB business for a further down cycle and believes it is set up well going into 2027.
- Potential Market Expansion from Brick SubstitutionLP is seeing a small but encouraging preference shift away from brick because of its labor intensity and cost. Management said this could expand SmartSide's addressable market geographically, although it is not expected to be a massive growth driver.
- No Current WUI Impact on Sell-ThroughLP said it has not seen a change in western sell-through rates relative to housing starts from wildfire-urban-interface codes, despite increased focus on those codes in Colorado.
DE:LP3 Earnings History
| Report Date | Fiscal Quarter | Forecast / EPS | Last Year's EPS | EPS YoY Change | Press Release |
|---|---|---|---|---|---|
| Feb 23, 2027 | 2026 (Q4) | -0.05- | 0.03 | ― | ― |
| Nov 03, 2026 | 2026 (Q3) | 0.190.35 | 0.32 | 8.33% (+0.03) | |
| Aug 05, 2026 | 2026 (Q2) | 0.500.36 | 0.89 | -59.60% (-0.53) | |
| May 06, 2026 | 2026 (Q1) | 0.140.34 | 1.14 | -70.08% (-0.80) | |
| Feb 17, 2026 | 2025 (Q4) | -0.010.03 | 0.92 | -97.09% (-0.90) | |
| Nov 05, 2025 | 2025 (Q3) | 0.340.32 | 1.09 | -70.49% (-0.77) | |
| Aug 06, 2025 | 2025 (Q2) | 0.930.89 | 1.87 | -52.63% (-0.98) | |
| May 06, 2025 | 2025 (Q1) | 1.061.14 | 1.37 | -16.99% (-0.23) | |
| Feb 19, 2025 | 2024 (Q4) | 0.770.92 | 0.64 | 45.07% (+0.29) | |
| Nov 05, 2024 | 2024 (Q3) | 0.791.09 | 1.45 | -24.69% (-0.36) |
The table shows recent earnings report dates and whether the forecast was beat or missed. See the change in forecast and EPS from the previous year.
