


Gladstone Commercial earnings date
Gladstone Commercial (GLE) Q3 2026 Earnings Report
DE:GLE Q3 2026 EPS Results
- Actual EPS
- -EUR 0.10
- Consensus EPS
- EUR 0.03
- Beat/Miss
- Missed by -EUR 0.13
- One Year Ago EPS
- EUR 0.02
DE:GLE Q3 2026 Revenue Results
- Actual Revenue
- EUR 38.69M
- Expected Revenue
- EUR 38.81M
- Beat/Miss
- Missed by -EUR 128.59K
- YoY Revenue Growth
- +3.86%
Earnings Announcement Details
- Quarter
- Q3 2026
- Date
- 11/03/2026
- Time
- After Close
- Conference Call
- Tuesday, November 3, 2026
Gladstone Commercial's next earnings date is estimated for February 24, 2027, based on past reporting schedules.
Q3 2026 Earnings Call Audio
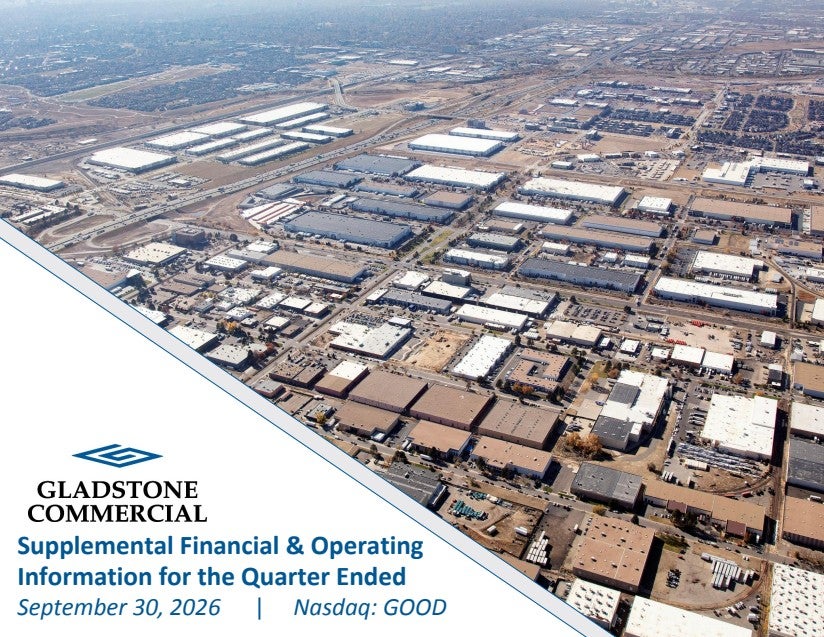
Q3 2026 Earnings Slide Deck
Q3 2026 Earnings Call Summary
The call was broadly constructive, supported by strong occupancy, full rent collections, industrial leasing gains, higher nine-month FFO, positive industrial market fundamentals, and ample liquidity. Offsetting concerns included elevated interest rates, wide acquisition pricing gaps, higher expenses, office leasing and impairment challenges, upcoming debt maturities, and expected occupancy pressure from lease expirations. Overall, the operational and strategic positives outweighed the challenges.
Management’s near term goal is 70% plus industrial annualized straight line rent, with a targeted payback period between 6 and 9 months for office leasing capital expenditures; acquisition underwriting requires cap rates going in the door of 7.5% and an average cap over the term of the lease of 10-plus years, north of 9. Management has about 15 opportunities within its pipeline for a combined total of over $200 million, but will not lower its underwriting standards. Occupancy may go below 99%, with 2027 vacancy currently expected to be 5%, dropping in a very short period of time down to 2.66%; an existing tenant is expected to add approximately 40 thousand-square-foot in the early part of the first quarter. Gary Gerson said, “we do not give forward guidance,” and did not expect anything significant either way heading into year end and the beginning of 2027.
- Industrial Property AcquisitionThe company acquired a 147,000-square-foot industrial property in Red Bud, Illinois, leased to Ultra Place Systems for $6.55 million, with more than 8 years remaining on the lease at acquisition. David Gladstone later referenced the acquisition as 146,000 square feet.
- Successful Leasing Activity and Rent GrowthThe company renewed or leased more than 137,000 square feet of office space and more than 265,000 square feet of flex industrial space during the quarter, increasing straight-line rent by approximately $2.5 million annually. Subsequent to quarter-end, it renewed or leased 153,000 square feet of industrial space and 67,300 square feet of office space, adding $2.89 million of annual straight-line rent.
- Full Cash Rent CollectionsThe company collected 100% of cash-based rents during the period, and management said tenants were paying as agreed across both the office and industrial portfolios.
- High Portfolio Occupancy and Long Lease DurationPortfolio occupancy increased to 99.3% as of September 30, 2026, from 98.7% in the prior quarter, with a 7.1-year average remaining lease term.
- Growing Industrial Portfolio ConcentrationIndustrial properties represented 69% of annualized straight-line rent at quarter-end, and management continues to work toward its near-term goal of at least 70% industrial annualized straight-line rent.
- Improved Funds From Operations for the Nine-Month PeriodThird-quarter FFO and core FFO available to common stockholders were both $0.35 per share, unchanged from the third quarter of 2025. For the nine months ended September 30, 2026, both FFO and core FFO were $1.07 per share, compared with $1.02 and $1.03 per share, respectively, in the same period of 2025.
- Higher Operating RevenueThird-quarter operating revenue increased to $42.4 million from $40.8 million in the same period of 2025, driven by a larger portfolio, increased recovery revenue, and higher rental rates.
- Positive Same-Store Lease RevenueSame-store lease revenue increased 0.2% for the nine months ended September 30, 2026, compared with the same period in 2025, due to higher recovery revenue from property expenses and increased straight-line rent from leasing activity.
- Austin Leasing ProgressThe company leased 82,000 square feet at its Austin office property, approximately 25% of the building, and is continuing to work on leasing the remaining space. Management also said it was in discussions with an existing tenant about adding approximately 40,000 square feet.
- Renewals Expected to Reduce 2027 ExposureThree properties were renewed near the end of the third quarter with a rent increase of approximately $2.8 million. Management said the properties of concern for 2027 declined from 12 to 8, and projected 2027 exposure to decline from 5% to 2.66% in a short period.
- Strong Industrial Market FundamentalsIndustrial net absorption reached 76.6 million square feet, the strongest quarter since early 2023, with year-to-date absorption of 203 million square feet, up 69% from the same period last year. National vacancy declined to 6.8%, down 20 basis points from its late-2025 peak, while asking rents increased 4% year over year.
- Available Liquidity and Hedged DebtThe company had approximately $7.7 million of cash and $70.2 million of availability under its line of credit. Its debt profile was 47% fixed rate, 46% hedged floating rate, and 7% floating rate, with all outstanding bank term loans hedged to maturity through interest-rate swaps.
- Capital Recycling and Industrial Growth StrategyManagement plans to continue growing industrial concentration through lease renewals, extensions, strategic capital investments, and potential dispositions of noncore assets, while evaluating build-to-suit opportunities and redeploying proceeds into quality industrial assets.
- Stable DividendThe common stock dividend remained $0.30 per quarter, or $1.20 per share annually.
- Acquisition Pipeline and Underwriting DisciplineManagement was reviewing approximately 15 acquisition opportunities representing more than $200 million in total value. It said it would not lower underwriting standards and was seeking going-in cap rates of 7.5% and an average cap rate over lease terms of more than 9% for leases averaging over 10 years.
- Industrial Supply Remains ConstrainedNew industrial deliveries were 13% below last year's pace. Although the development pipeline increased 23% year over year, approximately 35% of the pipeline was build-to-suit, which management said keeps speculative supply in check.
DE:GLE Earnings History
| Report Date | Fiscal Quarter | Forecast / EPS | Last Year's EPS | EPS YoY Change | Press Release |
|---|---|---|---|---|---|
| Feb 24, 2027 | 2026 (Q4) | 0.03- | 0.05 | ― | ― |
| Nov 03, 2026 | 2026 (Q3) | 0.03-0.10 | 0.02 | -650.00% (-0.12) | |
| Aug 05, 2026 | 2026 (Q2) | 0.040.10 | 0.03 | 266.67% (+0.07) | |
| May 05, 2026 | 2026 (Q1) | 0.050.07 | 0.04 | 100.00% (+0.04) | |
| Feb 18, 2026 | 2025 (Q4) | 0.020.05 | 0.08 | -44.44% (-0.04) | |
| Nov 03, 2025 | 2025 (Q3) | 0.070.02 | 0.18 | -90.00% (-0.16) | |
| Aug 06, 2025 | 2025 (Q2) | 0.080.03 | -0.04 | 175.00% (+0.06) | |
| May 07, 2025 | 2025 (Q1) | 0.030.04 | 0.01 | 300.00% (+0.03) | |
| Feb 18, 2025 | 2024 (Q4) | 0.070.08 | 0.03 | 200.00% (+0.05) | |
| Nov 04, 2024 | 2024 (Q3) | -0.040.18 | -0.04 | 600.00% (+0.22) |
The table shows recent earnings report dates and whether the forecast was beat or missed. See the change in forecast and EPS from the previous year.
