

Bristow Group (ERG1) Q2 2026 Earnings Report
DE:ERG1 Q2 2026 EPS Results
- Actual EPS
- EUR 0.62
- Consensus EPS
- EUR 0.80
- Beat/Miss
- Missed by -EUR 0.17
- One Year Ago EPS
- EUR 0.95
DE:ERG1 Q2 2026 Revenue Results
- Actual Revenue
- EUR 367.45M
- Expected Revenue
- EUR 363.46M
- Beat/Miss
- Beat by +EUR 3.99M
- YoY Revenue Growth
- +9.38%
Earnings Announcement Details
- Quarter
- Q2 2026
- Date
- 08/04/2026
- Time
- After Close
- Conference Call
- Tuesday, August 4, 2026
Bristow Group's next earnings date is estimated for November 3, 2026, based on past reporting schedules.
Q2 2026 Earnings Call Audio
Q2 2026 Earnings Slide Deck
Q2 2026 Earnings Call Summary
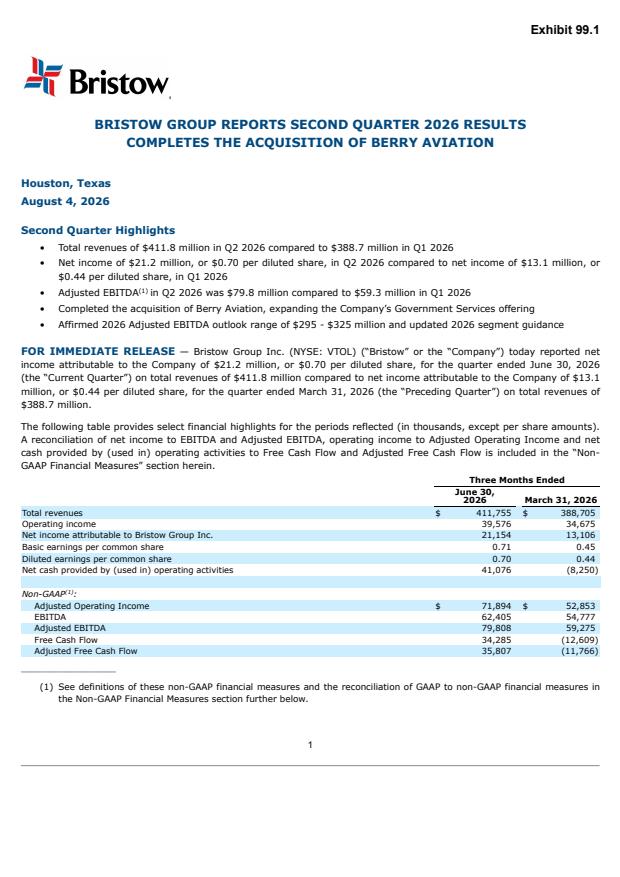
The call presented strong operational and financial positives: affirmed 2026 adjusted EBITDA guidance with ~25% growth, sequential revenue and EBITDA improvement, immediate accretive M&A (Berry Aviation), tightened OES guidance, upgraded Government Services revenue and a materially higher adjusted operating income range versus 2025 midpoint, and improved quarterly operating cash flow and liquidity. Offsetting items were focused and mostly execution/timing related: supply chain and OEM delivery delays causing roughly $8M of 2026 operating income pressure in Government Services, a $1.5M fuel-related margin hit (now contractually mitigated), elevated transition and working capital costs, and early-stage disposal of the Norway business. Overall the positives—sizable guidance affirmation, accretive acquisition, better cash generation, and long-term market tailwinds—outweigh the limited but notable execution headwinds.
Management affirmed full‑year 2026 consolidated guidance of $1.6–$1.7 billion in revenues and $295–$325 million of adjusted EBITDA (≈25% year‑over‑year growth), with segment updates including OES adjusted operating income raised to $235–$245 million, Government Services revenues revised to $475–$495 million with adjusted operating income of $55–$65 million (roughly 60% higher vs. the 2025 midpoint), and Other Services revenues of $155–$175 million with adjusted operating income of $25–$30 million; they closed the Berry Aviation acquisition (July 13), which they expect to be immediately accretive to earnings and free cash flow and to bolster EBITDA margins, noted the planned Norway OES exit would be neutral to 2025 EBITDA on a pro‑forma basis, reported unrestricted cash of $312 million and total liquidity of ≈$372 million, Q2 operating cash flow of $41.4 million (versus $(8.3) million in Q1), paid $3.7 million of dividends and declared $0.125/share, disclosed total 2026 CapEx of ~$160 million (growth $130M + maintenance $30M), and cautioned about a ~ $8 million 2026 adverse impact from supply‑chain delays (plus a $1.5 million fuel timing effect now addressed contractually).
- Affirmed Full-Year 2026 Adjusted EBITDA GuidanceCompany affirmed adjusted EBITDA guidance of $295M to $325M for full-year 2026, representing approximately 25% year-over-year growth versus prior year expectations.
- Sequential Revenue and EBITDA Improvement in Q2Total revenues in Q2 were $23.1M higher than Q1 and adjusted EBITDA increased by $20.5M sequentially, driven by higher utilization in Other Services and stronger fuel revenue and rates in OES.
- Berry Aviation Acquisition ClosedClosed acquisition of Berry Aviation on July 13 (fleet >20 aircraft). Management expects the acquisition to be immediately accretive to earnings and free cash flow, bolster EBITDA margins, and expand Government Services capabilities and addressable market.
- OES Segment Outperformance and Guidance TighteningOES revenues rose $7.3M sequentially and adjusted operating income was $16.4M higher quarter-over-quarter. Management tightened OES revenue guidance and increased adjusted operating income guidance for the segment to $235M–$245M for 2026.
- Government Services Revenue Upgrade and Large Mid-Point ImprovementUpdated Government Services 2026 revenue guidance to $475M–$495M and adjusted operating income to $55M–$65M. Management noted this adjusted operating income range is roughly 60% higher versus the 2025 midpoint on a comparable basis (including Berry).
- Improved Cash Flow and Strong LiquidityUnrestricted cash of $312M and total available liquidity of ~$372M as of June 2026. Net cash provided by operating activities was $41.4M in Q2 vs. net cash used of $8.3M in Q1. Company reiterated expectation of accelerating free cash flow as transitions complete.
- Strategic Positioning: Defense, Energy Security and ElectrificationManagement highlighted three long-term tailwinds: expected multiyear increases in defense spending, favorable indicators for offshore energy activity, and progress in advanced air mobility (Project SEAN GBP 1.5M support and multiple test programs), creating optionality with limited near-term capital.
DE:ERG1 Earnings History
| Report Date | Fiscal Quarter | Forecast / EPS | Last Year's EPS | EPS YoY Change | Press Release |
|---|---|---|---|---|---|
| Nov 03, 2026 | 2026 (Q3) | 1.02- | 1.53 | ― | ― |
| Aug 04, 2026 | 2026 (Q2) | 0.800.62 | 0.95 | -34.58% (-0.33) | |
| May 05, 2026 | 2026 (Q1) | 0.900.39 | 0.81 | -51.65% (-0.42) | |
| Feb 25, 2026 | 2025 (Q4) | 0.800.54 | 0.95 | -42.45% (-0.40) | |
| Nov 04, 2025 | 2025 (Q3) | 0.841.53 | 0.79 | 93.91% (+0.74) | |
| Aug 05, 2025 | 2025 (Q2) | 0.700.95 | 1.17 | -18.13% (-0.21) | |
| May 06, 2025 | 2025 (Q1) | 0.510.81 | 0.21 | 295.65% (+0.61) | |
| Feb 26, 2025 | 2024 (Q4) | 0.430.95 | 0.38 | 150.59% (+0.57) | |
| Nov 05, 2024 | 2024 (Q3) | 0.520.79 | 0.13 | 491.33% (+0.66) | |
| Aug 06, 2024 | 2024 (Q2) | 0.381.17 | -0.41 | 387.89% (+1.57) |
The table shows recent earnings report dates and whether the forecast was beat or missed. See the change in forecast and EPS from the previous year.