


Hydrofarm Holdings Group earnings date
Hydrofarm Holdings Group (5TU0) Q2 2025 Earnings Report
DE:5TU0 Q2 2025 EPS Results
- Actual EPS
- -EUR 0.49
- Consensus EPS
- -EUR 1.97
- Beat/Miss
- Beat by +EUR 1.48
- One Year Ago EPS
- -EUR 1.92
DE:5TU0 Q2 2025 Revenue Results
- Actual Revenue
- EUR 35.70M
- Expected Revenue
- EUR 38.13M
- Beat/Miss
- Missed by -EUR 2.43M
- YoY Revenue Growth
- -28.38%
Earnings Announcement Details
- Quarter
- Q2 2025
- Date
- 08/12/2025
- Time
- Before Open
- Conference Call
- Tuesday, August 12, 2025
Hydrofarm Holdings Group's next earnings date is estimated for April 1, 2027, based on past reporting schedules.
Q2 2025 Earnings Call Audio
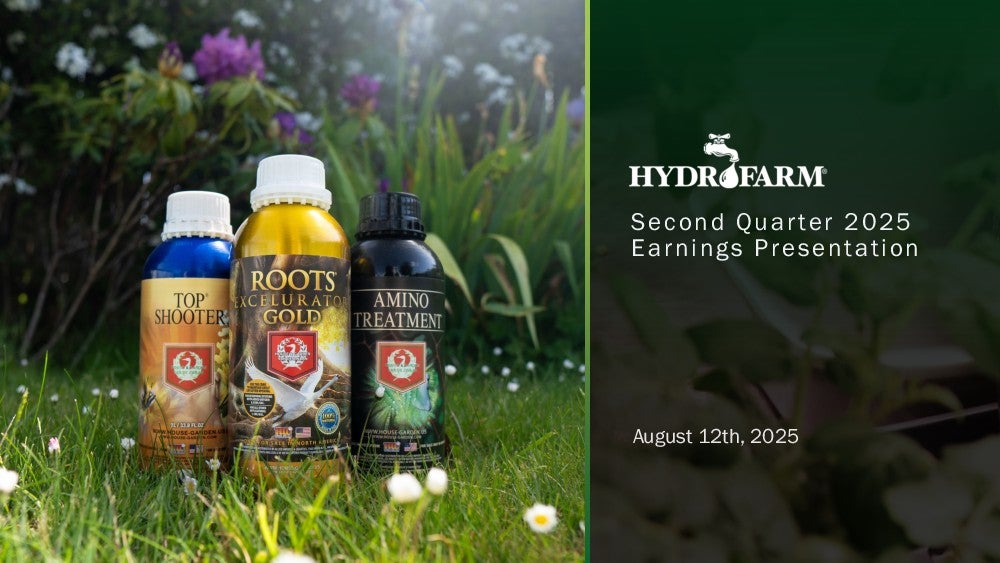
Q2 2025 Earnings Slide Deck
Q2 2025 Earnings Call Summary
The earnings call presented a mixed picture with notable achievements in SG&A savings, restructuring plans, and international sales growth. However, these were offset by significant declines in net sales and gross profit margins, as well as challenges in the durable products segment and tariff impacts.
During the Hydrofarm Holdings Group's Second Quarter 2025 Earnings Conference Call, several key metrics were highlighted to provide guidance on the company's performance and strategic initiatives. The company achieved a 16% reduction in adjusted SG&A expenses, marking the 12th consecutive quarter of year-over-year savings in this area. Despite industry headwinds, including a 28.4% year-over-year decline in net sales to $39.2 million and a 27.9% decrease in volume mix, the company managed to deliver positive free cash flow of $1.4 million for the quarter. Adjusted gross profit stood at $7.5 million, or 19.2% of net sales, although negatively impacted by restructuring charges. Hydrofarm initiated a restructuring plan to optimize its product portfolio, targeting annual cost savings exceeding $3 million, primarily through reducing inventory and SKUs. The company remains focused on improving its proprietary brand mix, which accounted for 55% of sales in the first quarter, despite a softer mix in the second quarter due to challenging demand in the durables category. The company also noted a $300,000 impact from tariffs and is actively managing its sourcing strategies to mitigate future effects. With cash on hand at $11 million and total liquidity of $20 million as of June 30, 2025, Hydrofarm is well-positioned to navigate the current market challenges while remaining optimistic about future industry demand improvements.
- SG&A Savings and Positive Free Cash FlowDelivered the 12th consecutive quarter of year-over-year adjusted SG&A savings with a nearly 16% reduction in expenses compared to 2024, resulting in positive free cash flow for the quarter.
- Restructuring Plan for Improved ProfitabilityInitiated a new restructuring plan to focus on higher-margin brands and optimize distribution and manufacturing, expecting annual cost savings in excess of $3 million.
- International Sales GrowthInternational sales improved year-on-year with notable results in select European and Asian countries, driving diversification of revenue streams.
- Consumables Outperform DurablesConsumable products outperformed durable products, with the consumables mix increasing to approximately 80% of sales in the second quarter.
DE:5TU0 Earnings History
| Report Date | Fiscal Quarter | Forecast / EPS | Last Year's EPS | EPS YoY Change | Press Release |
|---|---|---|---|---|---|
| Apr 01, 2027 | 2026 (Q4) | ―- | -0.98 | ― | ― |
| Nov 16, 2026 | 2026 (Q3) | ―-1.47 | -0.85 | -73.84% (-0.62) | |
| Aug 14, 2026 | 2026 (Q2) | ―-0.55 | -0.49 | -12.27% (-0.06) | |
| May 13, 2026 | 2026 (Q1) | ―-0.98 | -0.47 | -106.92% (-0.51) | |
| Mar 27, 2026 | 2025 (Q4) | -2.66-0.97 | -1.2 | 18.57% (+0.22) | |
| Nov 12, 2025 | 2025 (Q3) | -2.81-0.85 | -0.08 | -1019.28% (-0.77) | |
| Aug 12, 2025 | 2025 (Q2) | -1.97-0.49 | -1.92 | 74.54% (+1.43) | |
| May 13, 2025 | 2025 (Q1) | -3.38-0.47 | -0.77 | 38.61% (+0.30) | |
| Mar 05, 2025 | 2024 (Q4) | -2.20-1.20 | -1.24 | 3.74% (+0.05) | |
| Nov 07, 2024 | 2024 (Q3) | ―-0.08 | 0.12 | -160.58% (-0.20) |
The table shows recent earnings report dates and whether the forecast was beat or missed. See the change in forecast and EPS from the previous year.
