


Transcontinental earnings date
Transcontinental (53L) Q3 2026 Earnings Report
DE:53L Q3 2026 EPS Results
- Actual EPS
- EUR 0.20
- Consensus EPS
- EUR 0.24
- Beat/Miss
- Missed by -EUR 0.04
- One Year Ago EPS
- EUR 0.44
DE:53L Q3 2026 Revenue Results
- Actual Revenue
- EUR 194.38M
- Expected Revenue
- EUR 187.60M
- Beat/Miss
- Beat by +EUR 6.79M
- YoY Revenue Growth
- -55.29%
Earnings Announcement Details
- Quarter
- Q3 2026
- Date
- 09/09/2026
- Time
- Before Open
- Conference Call
- Wednesday, September 9, 2026
Transcontinental's next earnings date is estimated for December 9, 2026, based on past reporting schedules.
Q3 2026 Earnings Call Audio
No earnings call audio is available for this earnings event.
Q3 2026 Earnings Slide Deck
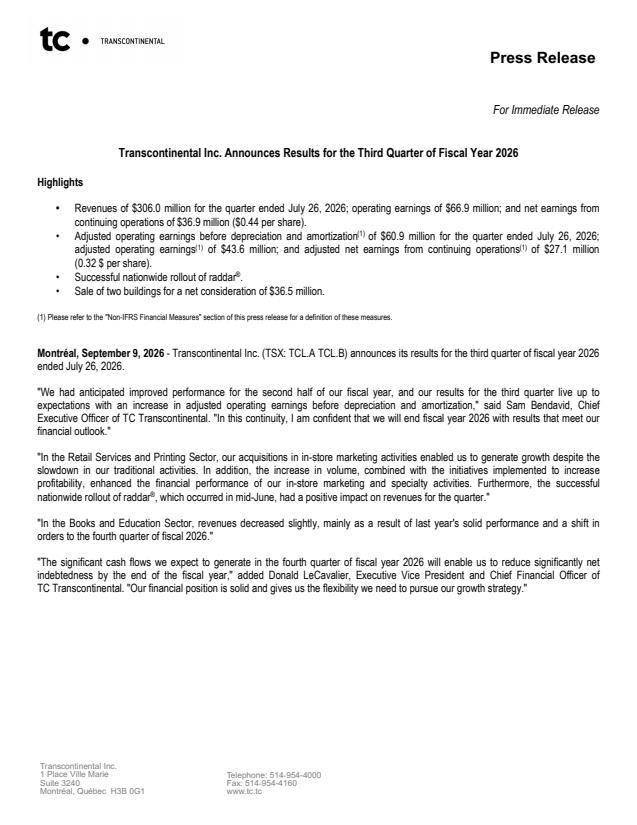
Q3 2026 Earnings Call Summary
The call was broadly positive. Management highlighted year-over-year revenue, adjusted EBITDA and EPS growth, strong ISM organic performance, ahead-of-plan integration, the completed raddar rollout, improving leverage and confidence in the fiscal 2026 outlook. These positives outweighed challenges including lower traditional volumes, the Books and Education decline, lower operating cash flow, higher tax expense, the foreign exchange loss and uncertainty regarding raddar profitability and the 2027 outlook.
Management remains confident in its ability to close fiscal 2026 in line with its financial outlook, including generating adjusted EBITDA for fiscal 2026 in line with the previous year, an effective tax rate in the mid-20s, and CapEx of about $60 million for the full year; it expects an important portion of the negative working capital year-to-date to reverse in the fourth quarter, bringing net debt to around 1.75x for year-end, with Books and Education expected to recover in the fourth quarter and deliver year-over-year flat, while the 2 remaining buildings are expected to sell over the next 12 months and together reach the original target of $100 million.
- Confidence in Fiscal 2026 OutlookManagement said the improved third-quarter performance reinforces its confidence in closing fiscal 2026 in line with the financial outlook and expects adjusted EBITDA for fiscal 2026 to be in line with the previous year.
- Consolidated Revenue and Adjusted EBITDA GrowthThird-quarter revenues increased 3.8% year over year, mainly due to acquisitions in ISM, partially offset by lower volume in traditional activities. Consolidated adjusted EBITDA was $60.9 million, up 4.1%, mainly due to acquisitions and cost reduction initiatives.
- Strong ISM and Specialty PerformanceISM and Specialty revenue increased 38% to $99.7 million, including close to 7% organic growth. Management said revenue and profitability growth exceeded the contribution from recent acquisitions.
- ISM Integration and Synergies Ahead of PlanIntegration of recent ISM acquisitions is progressing ahead of plan. Operations have been consolidated onto existing platforms, with synergies from procurement and operations lifting margins by a couple of percentage points.
- Strong ISM Acquisition PipelineManagement said the acquisition pipeline for ISM remains strong, with a continuing trend expected from the third quarter into the fourth quarter. Management also said the existing ISM business could double in size over time and that it is active on potential deals.
- Successful Nationwide raddar RolloutThe nationwide rollout of raddar was successfully completed in mid-June with strong participation from existing and new customers. Distribution expanded from roughly 5 million to more than 11 million households, and raddar is delivered weekly to approximately 3 in 4 Canadian households.
- Positive Advertiser Interest in raddarManagement reported good market feedback and advertiser interest in raddar, particularly from retailers in grocery, pharmacy and home improvement. raddar revenue is higher than revenue from the traditional retail flyer product.
- Newspaper Insourcing CompletedBoth phases of the newspaper insourcing were described as complete, with Phase 2 starting in August at the Halifax plant. Management said most of the benefits would be reflected in the third quarter.
- Retail Services and Printing Revenue GrowthRetail Services and Printing revenue increased 7.1% to $233.3 million, mainly due to recent acquisitions and the nationwide raddar rollout, partially offset by lower volume in traditional flyer printing activities.
- Retail Services and Printing EBITDA ImprovementAdjusted EBITDA in Retail Services and Printing increased 2.3% to $49.4 million, mainly due to recent acquisitions and cost reduction initiatives.
- Books and Education Order Recovery ExpectedManagement attributed the Books and Education revenue decline to order timing, including school ordering patterns and a supplier delivery issue, and said the missed volume should be recovered in the fourth quarter.
- Books Business Replaced Prior-Year One-Time ActivityManagement said the prior year benefited from a one-time business opportunity that was not repeated this year, but the team replaced that activity with business now entering the plants that is not a one-time event. Management was encouraged by the third-quarter results and forecast for the Books business.
- Limited Inflationary PressureManagement said strong contracts, including long-term contracts in some cases, have kept the impact of inflationary pressures very limited.
- Improved Leverage and Real Estate MonetizationThe sale of two buildings generated a net inflow of $36.5 million in the quarter and reduced net debt leverage to 2.06x from 2.14x three months earlier. Management expects leverage to reach around 1.75x at year-end. Total real estate monetization has reached $60 million, with Saint-Hyacinthe and another Montreal building expected to bring the total toward the original $100 million target.
- Corporate Cost Reduction MomentumAfter three quarters, the real decline in corporate costs was $3 million, including $2.1 million in the third quarter. Management said costs are moving in the right direction, with momentum expected to continue in the fourth quarter and increase next year.
- Adjusted EPS GrowthAdjusted earnings per share from continuing operations increased to $0.32 from $0.27 in the prior-year quarter, an 18.5% improvement.
- Capital Allocation Priorities DefinedManagement said near-term capital allocation priorities are the announced dividend, potential ISM or Education acquisitions, debt repayment if acquisitions are not completed, and a CapEx program in line with recent years.
- CapEx Remains Within Full-Year TargetThird-quarter CapEx was $19.8 million, higher than last year but still in line with the approximately $60 million full-year target.
- AI and Technology InitiativesManagement said it remains focused on technology initiatives, including AI-enabled projects, to support long-term productivity and growth. It may also increase future CapEx to defend the business or support raddar with technology.
DE:53L Earnings History
| Report Date | Fiscal Quarter | Forecast / EPS | Last Year's EPS | EPS YoY Change | Press Release |
|---|---|---|---|---|---|
| Dec 09, 2026 | 2026 (Q4) | 0.29- | 0.52 | ― | ― |
| Sep 09, 2026 | 2026 (Q3) | 0.240.20 | 0.44 | -54.29% (-0.24) | |
| Jun 03, 2026 | 2026 (Q2) | 0.130.12 | 0.37 | -67.24% (-0.25) | |
| Mar 10, 2026 | 2026 (Q1) | 0.090.05 | 0.31 | -83.67% (-0.26) | |
| Dec 10, 2025 | 2025 (Q4) | 0.540.52 | 0.5 | 3.80% (+0.02) | |
| Sep 04, 2025 | 2025 (Q3) | 0.440.44 | 0.38 | 16.67% (+0.06) | |
| Jun 04, 2025 | 2025 (Q2) | 0.340.37 | 0.33 | 11.54% (+0.04) | |
| Mar 11, 2025 | 2025 (Q1) | 0.230.31 | 0.27 | 13.95% (+0.04) | |
| Dec 11, 2024 | 2024 (Q4) | 0.460.50 | 0.53 | -4.82% (-0.03) | |
| Sep 11, 2024 | 2024 (Q3) | 0.350.38 | 0.32 | 17.65% (+0.06) |
The table shows recent earnings report dates and whether the forecast was beat or missed. See the change in forecast and EPS from the previous year.
