


Haverty earnings date
Haverty (25F) Q3 2026 Earnings Report
DE:25F Q3 2026 EPS Results
- Actual EPS
- EUR 0.22
- Consensus EPS
- EUR 0.37
- Beat/Miss
- Missed by -EUR 0.15
- One Year Ago EPS
- EUR 0.29
DE:25F Q3 2026 Revenue Results
- Actual Revenue
- EUR 181.22M
- Expected Revenue
- EUR 184.54M
- Beat/Miss
- Missed by -EUR 3.32M
- YoY Revenue Growth
- +4.46%
Earnings Announcement Details
- Quarter
- Q3 2026
- Date
- 11/04/2026
- Time
- Before Open
- Conference Call
- Wednesday, November 4, 2026
Haverty's next earnings date is estimated for February 17, 2027, based on past reporting schedules.
Q3 2026 Earnings Call Audio
No earnings call audio is available for this earnings event.
Q3 2026 Earnings Slide Deck
Q3 2026 Earnings Call Summary
The call was broadly positive, with sales, comparable-store performance, earnings, gross margin, e-commerce, store expansion, liquidity, and consumer credit metrics all showing strength. The company also raised its full-year gross margin guidance and maintained its capital investment plans. These positives were partly offset by declining traffic, higher SG&A and operating costs, fuel and freight inflation, supply-chain and tariff uncertainty, inventory-management challenges, and election-related marketing disruption.
For calendar year 2026, guidance includes tariffs currently in effect as of November 4, 2026, but excludes any future tariff refunds that may be received from indirectly sourced products; gross margins are expected to be between 61.3% and 61.5%, fixed and discretionary-type SG&A expenses are expected to remain in the $307 million-$309 million range, variable-type costs within SG&A are expected to be in the range of 19.2%-19.4%, planned CapEx remains at $34 million, including $27.7 million for anticipated new or replacement stores, remodels, and expansions, $3.2 million for investments in the distribution network, and approximately $3.1 million for investments in information technology, and the anticipated effective tax rate remains at 26%, excluding the impact of vesting of stock awards and any potential new tax legislation. Havertys expects to end the year with inventory somewhere between $90 million and $100 million, plans to open five new stores in Q4 and close one that will be a relocation, expects to end the year with 133 stores, and expects the ongoing refresh of its mattress departments and design centers to be completed in all stores in 2027.
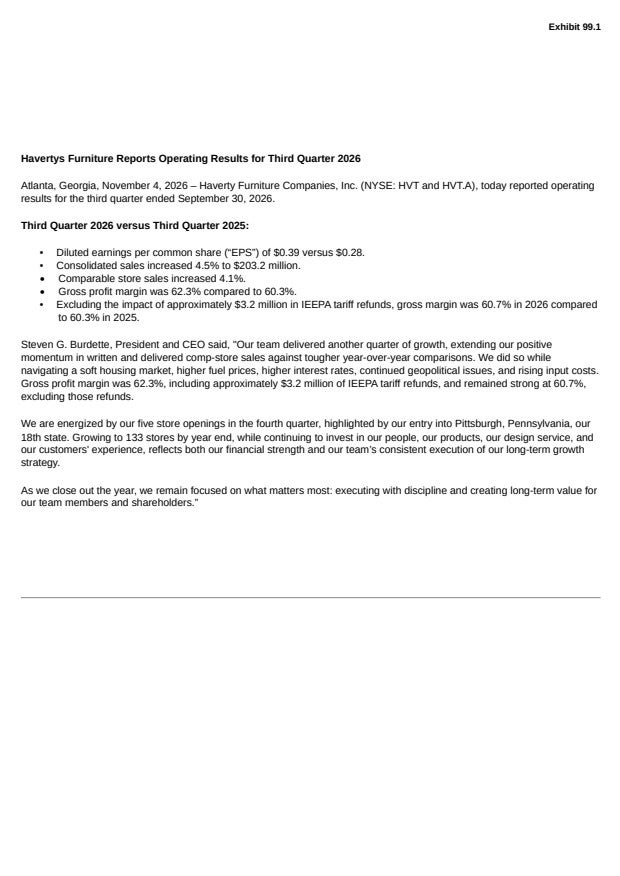
- Sales and Comparable-Store GrowthThird-quarter net sales increased 4.5% to $203.2 million, comparable-store sales rose 4.1%, total written sales increased 2.8%, and written comparable-store sales grew 2.3%, despite tougher year-over-year comparisons.
- Higher Profitability and EarningsPre-tax income increased to $8.6 million, or 4.2% of sales, compared with $6.4 million, or 3.3% of sales, a year ago. Net income rose to $6.3 million, or $0.39 per diluted share, from $4.7 million, or $0.28 per share.
- Gross Margin Expansion Supported by Tariff RefundsGross margin expanded 200 basis points to 62.3% from 60.3%, helped by approximately $3.2 million in tariff refunds recognized during the quarter.
- Improved Underlying Gross MarginExcluding tariff refunds, gross margin was 60.7% versus 60.3% in the prior-year quarter. Excluding LIFO expense, adjusted gross margin was 61.3% versus 60.6% a year ago.
- Higher Average Ticket and Stable ConversionQuarterly traffic declined by mid-single digits, but conversion rates held steady and average ticket increased 7.4%. Management said the average-ticket increase was primarily price-driven, with units per ticket remaining fairly flat.
- Designer and Custom-Order GrowthDesigner business grew 4% for the quarter and represented 34.6% of total business, while designer average ticket increased 7.2%. Custom orders reached 31.4% of upholstery business and increased 16.9% year over year.
- Positive Category Performance in Upholstery and Occasional FurnitureWritten upholstery business increased in the mid-single digits, while occasional bedroom and dining business rose in the low single digits.
- E-Commerce and Organic Traffic MomentumOrganic traffic to the company website continued to improve, supporting double-digit growth in written e-commerce sales for another quarter.
- Marketing Efficiency and Continued Promotional ActivityThe company said it continued to get more from its marketing spend, which was slightly lower for the quarter, and plans to remain active and aggressive with promotions through the remainder of the fourth quarter and into 2027.
- Expansion of AI ApplicationsHavertys continues to expand its use of AI into customer chat, sales and designer interfaces, marketing, supply chain, and home delivery to help teams provide relevant and accurate information to customers.
- Successful New Market Opening and Store ExpansionThe new Fredericksburg, Virginia market was outperforming traffic and volume expectations. The company opened McKinney, Texas, is entering its 18th state with the Pittsburgh opening, plans five new stores in the fourth quarter, and expects to end the year with 133 stores.
- Planned Store, Mattress, and Design-Center InvestmentsThe ongoing refresh of mattress departments and design centers remains on track for completion in all stores in 2027. The company also has several new stores in lease negotiations for 2027.
- Strong Liquidity and Debt-Free Balance SheetHavertys ended the quarter with $120.3 million of cash and cash equivalents, no funded debt, and $100 million of credit availability under its revolving credit facility.
- Higher Customer DepositsCustomer deposits were $46.2 million at quarter-end, up $10.7 million from December 31, 2025, and up $2.4 million from the third quarter of 2025.
- Shareholder Returns and Buyback AuthorizationThe company paid $15.8 million of regular dividends year to date. The board authorized an additional $15 million of buyback capacity on August 7, 2026, leaving approximately $16.8 million of remaining authorization.
- Raised Full-Year Gross Margin GuidanceFull-year 2026 gross margin guidance was raised to 61.3%-61.5% due to the receipt of tariff refunds.
- Strong Credit Quality Among Financing CustomersManagement said the consumer is holding up well. Among customers using Synchrony financing, approval rates remained strong, with almost 90% approval in stores and credit scores above 750.
- Planned Capital InvestmentFull-year 2026 planned capital expenditures remain at $34 million, including $27.7 million for new or replacement stores, remodels, and expansions, $3.2 million for the distribution network, and approximately $3.1 million for information technology.
DE:25F Earnings History
| Report Date | Fiscal Quarter | Forecast / EPS | Last Year's EPS | EPS YoY Change | Press Release |
|---|---|---|---|---|---|
| Feb 17, 2027 | 2026 (Q4) | 0.45- | 0.45 | ― | ― |
| Nov 04, 2026 | 2026 (Q3) | 0.370.22 | 0.29 | -21.88% (-0.06) | |
| Aug 04, 2026 | 2026 (Q2) | 0.210.22 | 0.14 | 56.25% (+0.08) | |
| May 05, 2026 | 2026 (Q1) | 0.230.29 | 0.21 | 43.48% (+0.09) | |
| Feb 24, 2026 | 2025 (Q4) | 0.430.45 | 0.44 | 4.08% (+0.02) | |
| Oct 29, 2025 | 2025 (Q3) | 0.210.29 | 0.26 | 10.34% (+0.03) | |
| Jul 30, 2025 | 2025 (Q2) | 0.130.14 | 0.24 | -40.74% (-0.10) | |
| Apr 30, 2025 | 2025 (Q1) | 0.120.21 | 0.12 | 64.29% (+0.08) | |
| Feb 24, 2025 | 2024 (Q4) | 0.130.44 | 0.8 | -45.56% (-0.37) | |
| Oct 30, 2024 | 2024 (Q3) | 0.420.26 | 0.91 | -71.57% (-0.65) |
The table shows recent earnings report dates and whether the forecast was beat or missed. See the change in forecast and EPS from the previous year.
