


Navigator Holdings earnings date
Navigator Holdings (1NV) Q3 2026 Earnings Report
DE:1NV Q3 2026 EPS Results
- Actual EPS
- EUR 0.37
- Consensus EPS
- EUR 0.36
- Beat/Miss
- Beat by +EUR 0.01
- One Year Ago EPS
- EUR 0.33
DE:1NV Q3 2026 Revenue Results
- Actual Revenue
- EUR 140.65M
- Expected Revenue
- EUR 120.54M
- Beat/Miss
- Beat by +EUR 20.11M
- YoY Revenue Growth
- +1.27%
Earnings Announcement Details
- Quarter
- Q3 2026
- Date
- 11/03/2026
- Time
- After Close
- Conference Call
- Tuesday, November 3, 2026
Navigator Holdings's next earnings date is estimated for March 17, 2027, based on past reporting schedules.
Q3 2026 Earnings Call Audio
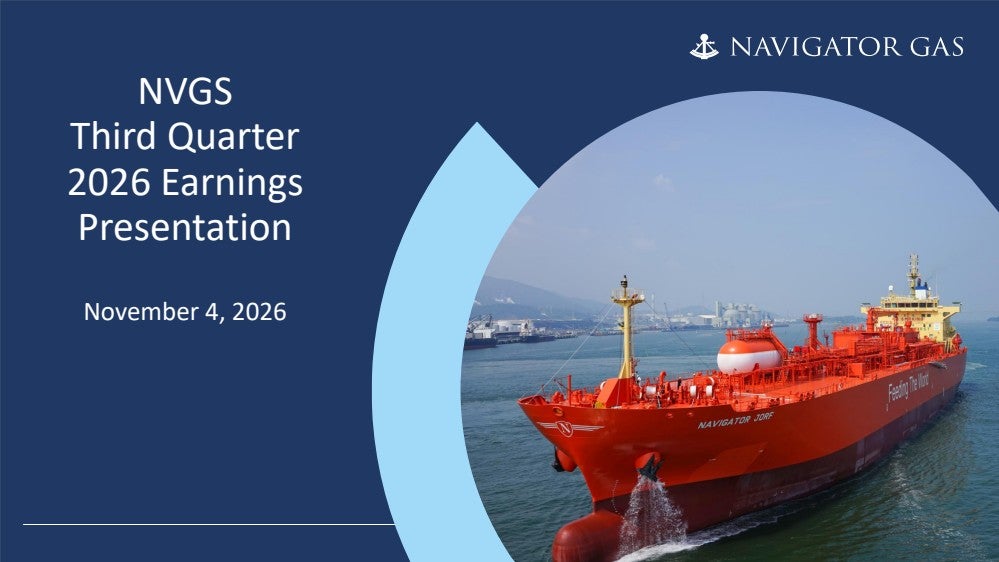
Q3 2026 Earnings Slide Deck
Q3 2026 Earnings Call Summary
The call was strongly positive. Although Q3 experienced the expected moderation in TCE, utilization, chartering activity, and terminal throughput, utilization and rates improved materially into September and October. Record reported earnings, lower leverage, strong liquidity, fully financed newbuilds, continued shareholder returns, favorable fleet supply-demand conditions, and improving Q4 indicators significantly outweighed the stated challenges.
For full-year 2026, guidance is $175 million-$177 million for vessel operating expenses, $39 million-$42 million for cash G&A, $123 million-$124 million for depreciation, and $42 million-$43 million for net interest expense, with vessel operating expenses forecast at $9,250 per day per vessel and all-in cash breakeven estimated at $21,720 per vessel per day; for the fourth quarter, the company expects higher utilization and higher TCE rates, volumes at its ethylene export terminal to recover from the seasonally softer third quarter, and fleet utilization, TCE, and terminal earnings to improve sequentially, while terminal profitability is expected to continue even if only the contracted volumes are sold next year; the company currently anticipates repurchasing $22.6 million of shares by December 31st, alongside a $0.08 per share dividend, for total capital returns of $27.4 million, or 35% of net income attributable to stockholders, and plans to repurchase 1 million shares over the next two months at the current share price.
- Record Reported EarningsQ3 delivered record reported EBITDA of $120.8 million, net income attributable to stockholders of $78.3 million, and EPS of $1.28, principally driven by approximately $48 million of profit on vessel sales.
- Solid Underlying Operating PerformanceAdjusted EBITDA was $67.8 million, adjusted net income attributable to stockholders was $25.4 million, and adjusted EPS was $0.42. The company said underlying earnings remained solid and the business remained profitable and cash generative.
- Utilization Recovered StronglyQuarterly utilization was 87.9%, but it recovered from around 85% in July and August to approximately 94% in September, with utilization remaining firm through October and into the start of Q4.
- Revenue Exceeded the Prior-Year QuarterTotal operating revenues were $155 million, slightly above $153 million in Q3 2025.
- Lower Vessel Operating ExpensesVessel operating expenses were $42.8 million, down 13% from the prior year. Per-vessel-per-day costs declined to $8,928 from $9,275 a year ago, reflecting the timing of costs and project-related expenses.
- Unigas Transaction CompletedNavigator completed the sale of eight vessels operating in the Unigas pool and its shares in the pool company for approximately $183 million of proceeds. The transactions generated approximately $70 million of total book gains, with $48 million recognized in Q3 and $22 million expected in Q4.
- Balance Sheet StrengthenedNet debt declined by approximately $153 million from $653 million at June 30 to just under $500 million at September 30. Net debt to last-twelve-month adjusted EBITDA fell to 1.7x from over 2x at the end of June.
- Strong Liquidity PositionTotal liquidity was approximately $425.8 million at September 30, including $156.7 million of undrawn vessel facilities. By October 31, total liquidity had increased to approximately $482 million, including approximately $434 million of available liquidity excluding restricted cash.
- Capital Returned to ShareholdersDuring Q3, Navigator repurchased 661,482 shares for approximately $14.2 million and paid a $0.07 cash dividend, returning $18.5 million, or 35% of Q2 net income attributable to stockholders. For Q4, the company declared a $0.08 per-share dividend, a 14% increase in the fixed dividend, and expects to return $27.4 million, or 35% of Q3 net income, including approximately $22.6 million of planned share repurchases.
- Newbuild Program Fully FinancedLong-term financing is in place for all six newbuild vessels, including two ammonia vessels financed at a margin of 135 basis points over SOFR from delivery. The program has a total shipyard cost of $586 million, with $153 million already paid and $461 million of debt financing secured.
- Fleet Renewal and Newbuild DeliveriesThe fleet renewal program includes four mid-sized dual-fuel liquefied ethane/ethylene carriers and two mid-sized ammonia-fueled liquefied ammonia carriers. The first newbuild is scheduled for delivery next month and will immediately commence a time charter; the remaining vessels are expected to be delivered over the next two years.
- Healthy Cash Breakeven and Earnings ConsistencyThe estimated 2026 all-in cash breakeven is $21,720 per vessel per day versus Q3 TCE of $30,314 per day, providing approximately $8,600 per day, or about 40% of cash breakeven, in headroom. Adjusted EBITDA has been at least $60 million for 15 consecutive quarters since the start of 2023, averaging $72 million over that period.
- Improving Market Conditions and Q4 OutlookManagement reported higher utilization and TCE rates entering Q4 and expects fleet utilization, TCE, and terminal earnings to improve sequentially. Rates were described as firming across LPG, ethane, and ethylene, while ethylene spot rates had nearly doubled from the quiet months of June and July.
- Favorable Handysize Supply-Demand ProfileThe Handysize order book remains around 7% of the fleet, the lowest among gas carrier segments, while approximately 17% of the existing Handysize fleet is more than 25 years old. Industry sources forecast approximately 37 million tons of additional global LPG export capacity by 2030, along with additional U.S. ethane export capacity and several million tons of new ammonia production.
- Longer Voyages Supporting DemandContinued disruption around the Strait of Hormuz, fewer Panama Canal slots, higher costs, longer waits, and rerouting through the Cape of Good Hope are extending voyages and adding ton-miles. Management said the disruption is commercially positive for the company by supporting U.S. natural gas liquids and petrochemical exports.
- Ethylene Export Demand ImprovingAsia's share of U.S. ethylene exports increased from zero in Q2 to around three-quarters by September. Management expects terminal throughput to recover in Q4 due to higher naphtha prices, global inventory restocking, and stronger demand from Asia.
- Terminal Commercial Activity Remains StrongFour new offtake contracts have been signed since January, and customers are discussing new take-or-pay contracts beginning in 2027. Management expects the remaining Q4 capacity to be marketed at firm spot rates and said profitability is expected to continue next year even if only contracted volumes are sold.
- Flexible Fleet and Charter CoverageNavigator's ability to trade across LPG and petrochemical markets was described as supporting earnings resilience. The first ethylene newbuild has a one-year charter at healthy rates upon delivery, while the two ammonia vessels are on five-year charters.
- Disciplined Growth and Buyback PrioritiesManagement intends to balance disciplined fleet growth with capital returns, including potential consolidation opportunities, additional newbuildings, and opportunistic share repurchases when the share price is weak. The company noted that its shares trade at a significant discount to net asset value of more than $32 per share.
DE:1NV Earnings History
| Report Date | Fiscal Quarter | Forecast / EPS | Last Year's EPS | EPS YoY Change | Press Release |
|---|---|---|---|---|---|
| Mar 17, 2027 | 2026 (Q4) | 0.49- | 0.29 | ― | ― |
| Nov 03, 2026 | 2026 (Q3) | 0.360.37 | 0.33 | 13.89% (+0.05) | |
| Aug 04, 2026 | 2026 (Q2) | 0.480.77 | 0.13 | 508.57% (+0.65) | |
| May 06, 2026 | 2026 (Q1) | 0.350.46 | 0.33 | 36.96% (+0.12) | |
| Mar 11, 2026 | 2025 (Q4) | 0.370.29 | 0.34 | -16.05% (-0.06) | |
| Nov 04, 2025 | 2025 (Q3) | 0.330.33 | 0.26 | 24.14% (+0.06) | |
| Aug 12, 2025 | 2025 (Q2) | 0.190.13 | 0.31 | -58.82% (-0.18) | |
| May 14, 2025 | 2025 (Q1) | 0.270.33 | 0.29 | 16.46% (+0.05) | |
| Mar 12, 2025 | 2024 (Q4) | 0.290.34 | 0.28 | 21.41% (+0.06) | |
| Nov 06, 2024 | 2024 (Q3) | 0.290.26 | 0.25 | 6.23% (+0.02) |
The table shows recent earnings report dates and whether the forecast was beat or missed. See the change in forecast and EPS from the previous year.
