

Lendlease Group (LLC) Q4 2026 Earnings Report
CH:LLC Q4 2026 EPS Results
- Actual EPS
- -CHF 0.30
- Consensus EPS
- -CHF 0.15
- Beat/Miss
- Missed by -CHF 0.16
- One Year Ago EPS
- CHF 0.22
CH:LLC Q4 2026 Revenue Results
- Actual Revenue
- CHF 1.49B
- Expected Revenue
- CHF 1.76B
- Beat/Miss
- Missed by -CHF 264.97M
- YoY Revenue Growth
- -19.58%
Earnings Announcement Details
- Quarter
- Q4 2026
- Date
- 08/16/2026
- Time
- After Close
- Conference Call
- Sunday, August 16, 2026
Lendlease Group's next earnings date is estimated for February 15, 2027, based on past reporting schedules.
Q4 2026 Earnings Call Audio
Q4 2026 Earnings Slide Deck
Q4 2026 Earnings Call Summary
The call presented a mixed picture: strong operational progress in the IDC segments (notably Construction), meaningful cost reductions, substantial liquidity and transactional successes in Investments, and a constructive FY '27 IDC earnings outlook. Offsetting these positives were large CRU-related losses, significant impairments and provisions, reduced FUM and fee income, and elevated net debt/gearing driven by timing delays in capital recycling. The company outlined clear levers to deleverage and improve returns, but near-term financial metrics remain impacted by legacy CRU issues and timing of transactions.
Management guided IDC earnings per security of $0.37–$0.41 for FY‑27 (≈16% EPS growth at the midpoint) after IDC delivered FY‑26 EBITDA of $542m, while reiterating no specific FY‑27 guidance for the Capital Release Unit (CRU). Construction is expected to keep growing from FY‑26 revenue of $3.9bn (+29% YoY) and FY‑26 EBITDA $167m (EBITDA margin 4.3%), with a through‑the‑cycle EBITDA margin target of 3–4% supported by an $8.4bn backlog (+42%), $6.4bn of new work (+28%), a $5.2bn preferred workbook and $13bn of active bids. Development guidance is underpinned by a $13.2bn pipeline, ~89% of WIP in JVs/fund‑throughs, >$8bn of completions in FY‑27–FY‑29 and circa $1.2bn of Lendlease gross proceeds / presales expected to settle in FY‑27; Investments continue to recycle capital after a $5bn FUM reduction while facilitating ~$7bn of partner liquidity and targeting average co‑invest holdings of 5–10%. On the balance sheet, reported gearing was 30.3% (underlying 37.7%; pro‑forma 30.2% after $1.3bn contracted transactions), available liquidity ≈ $4bn, FY‑26 net overheads fell 22% to $363m with an exit run‑rate ≈ $350m, FY‑26 distribution was $0.157 per security, and net finance costs are expected to remain elevated with cash inflows weighted to H2.
- IDC earnings delivered at top end of guidanceIDC earnings per security of $0.337 were delivered for FY '26 (at the top end of guidance) with IDC segment operating EBITDA of $542 million reflecting a stable investments result and a strong recovery in Construction.
- Construction: strong revenue, margin and backlog growthConstruction revenue was $3.9 billion (up 29% year-on-year), EBITDA of $167 million and an EBITDA margin of 4.3% (above target); new work secured was $6.4 billion (up 28%) and backlog revenue rose to $8.4 billion (up 42%).
- Material overhead reduction and ongoing cost disciplineNet group overheads fell from $466 million to $363 million, a reduction of 22% (net employee overhead down $84 million); exit run-rate for net overheads entered FY '27 at ~ $350 million with further savings targeted.
- Strong liquidity and balance sheet flexibilityCommitted and available liquidity of approximately $4.0 billion was maintained to support operations and capital recycling; group preserved investment-grade credit ratings while managing maturities and a bond redemption.
- Investment platform delivered strong transactional returnsLendlease Global Commercial REIT delivered total annual returns >20%; divestment of a Japanese data center returned an IRR >40%; the business facilitated ~ $7 billion of liquidity for investment partners and completed material transactions (e.g., TRX retail/office sales).
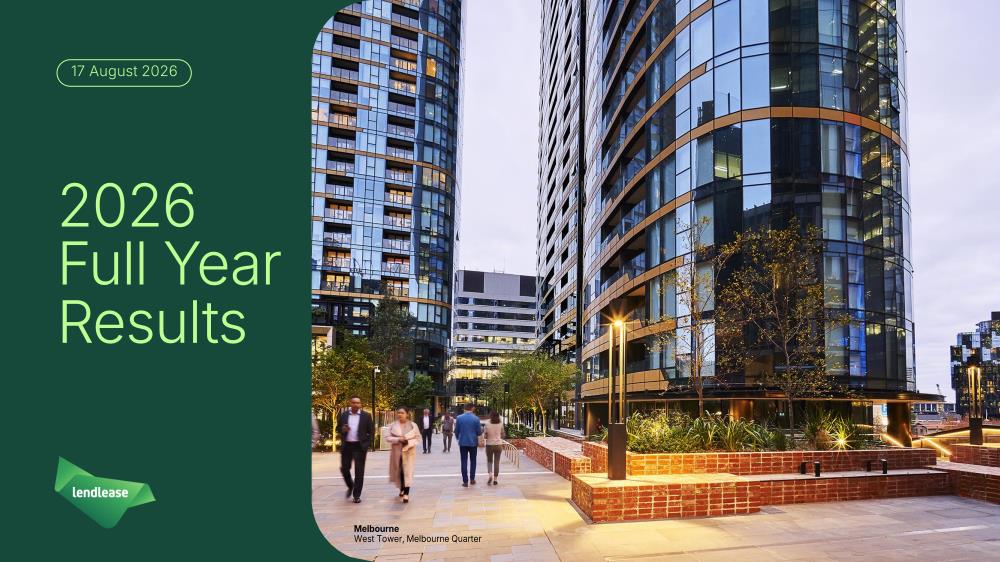
- Development pipeline replenished and major presales securedDevelopment pipeline grew to $13.2 billion; major completions included Victoria Cross Tower and West Tower at Melbourne Quarter; Lendlease has ~ $1.2 billion of gross presales/settlements expected to support FY '27 development earnings (One Circular Quay and Victoria Harbour) and One Circular Quay presales were ~79%+.
- Capital recycling progress including new JVCRU contracted $1.2 billion of transactions in FY '26 and post-balance date Lendlease established the Impact Partnership JV with the Crown Estate (3 of 6 projects transferred), supporting the capital-release strategy.
- Positive FY '27 IDC earnings outlookIDC earnings per security guidance of $0.37 to $0.41 for FY '27 (midpoint implies ~16% EPS growth vs FY '26), reflecting expected construction growth, development settlements and continued investment activity.
CH:LLC Earnings History
| Report Date | Fiscal Quarter | Forecast / EPS | Last Year's EPS | EPS YoY Change | Press Release |
|---|---|---|---|---|---|
| Feb 15, 2027 | 2027 (Q2) | -0.03- | -0.27 | ― | ― |
| Aug 16, 2026 | 2026 (Q4) | -0.15-0.30 | 0.22 | -239.74% (-0.52) | |
| Feb 22, 2026 | 2026 (Q2) | 0.03-0.27 | 0.1 | -363.84% (-0.37) | |
| Aug 17, 2025 | 2025 (Q4) | 0.220.22 | 0.17 | 31.03% (+0.05) | |
| Feb 16, 2025 | 2025 (Q2) | 0.110.10 | 0.05 | 101.14% (+0.05) | |
| Aug 18, 2024 | 2024 (Q4) | 0.170.17 | 0.11 | 51.04% (+0.06) | |
| Feb 18, 2024 | 2024 (Q2) | 0.150.05 | 0.09 | -42.11% (-0.04) | |
| Aug 13, 2023 | 2023 (Q4) | 0.110.11 | 0.18 | -40.19% (-0.07) | |
| Feb 12, 2023 | 2023 (Q2) | 0.120.09 | 0.08 | 8.57% (+0.01) | |
| Aug 21, 2022 | 2022 (Q4) | 0.260.18 | 0.03 | 629.55% (+0.16) |
The table shows recent earnings report dates and whether the forecast was beat or missed. See the change in forecast and EPS from the previous year.
