

Jumia Technologies AG (4JMA) Q2 2026 Earnings Report
CH:4JMA Q2 2026 EPS Results
- Actual EPS
- -CHF 0.06
- Consensus EPS
- -CHF 0.06
- Beat/Miss
- Met expectations
- One Year Ago EPS
- -CHF 0.10
CH:4JMA Q2 2026 Revenue Results
- Actual Revenue
- CHF 42.77M
- Expected Revenue
- CHF 43.10M
- Beat/Miss
- Missed by -CHF 326.22K
- YoY Revenue Growth
- +12.25%
Earnings Announcement Details
- Quarter
- Q2 2026
- Date
- 08/12/2026
- Time
- Before Open
- Conference Call
- Wednesday, August 12, 2026
Jumia Technologies AG's next earnings date is estimated for November 18, 2026, based on past reporting schedules.
Q2 2026 Earnings Call Audio
Q2 2026 Earnings Slide Deck
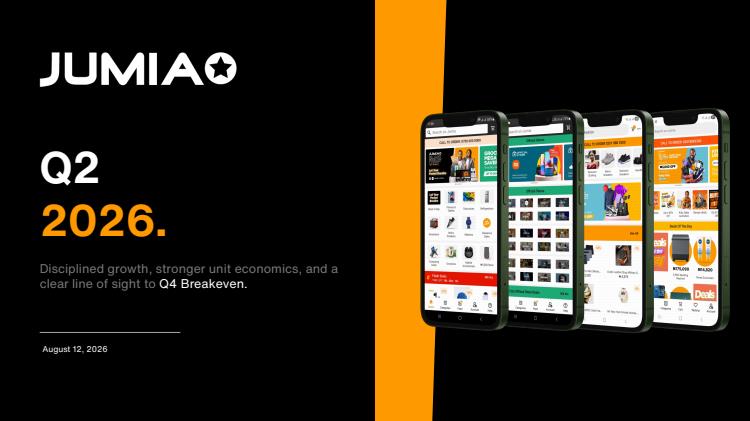
Q2 2026 Earnings Call Summary
The call emphasized meaningful progress toward profitability with strong usage, monetization and operating leverage: GMV +23% (adj.), gross profit +28%, adjusted EBITDA loss narrowed 36% and high‑growth advertising/warehousing revenue lines. These positive trends were offset by material near‑term headwinds — supply shortages in phones/electronics, temporary fuel surcharges, a demand shock in Ivory Coast, and a reduction in liquidity that prompted a $50M capital raise. Management maintained adjusted EBITDA and cash‑flow targets (breakeven in Q4'26) while moderating GMV guidance. On balance, the operational and profitability momentum outweighs the transitory external challenges.
Jumia updated 2026 guidance: full‑year GMV growth is now expected to be 20–30% year‑over‑year (adjusted for perimeter effects) with adjusted EBITDA forecast at negative $25M to negative $30M; Q3 GMV is guided to grow 15–25% YoY (adj.), and management reaffirmed its target to reach adjusted‑EBITDA breakeven and positive cash flow in Q4’26 and to deliver full‑year adjusted‑EBITDA profitability and positive cash flow in 2027. Management said the adjusted‑EBITDA and cash‑flow targets remain unchanged despite a lower GMV outlook, will modestly increase working capital in Q3 to capture supply opportunities and invest in fulfillment/marketing, and is pursuing a $50M capital raise (anchored by a $25M IFC investment) to strengthen the balance sheet.
- GMV and Usage GrowthGross merchandise value (GMV) grew 23% year‑over‑year (adjusted for perimeter effects). Physical goods orders rose 28% YoY and quarterly active customers increased 23% YoY (adjusted for perimeter effects), demonstrating continued platform usage momentum.
- Gross Profit and Monetization ExpansionGross profit increased 28% year‑over‑year to $30.7M, with gross profit margin up ~92 basis points to 14.2% of GMV. Marketplace revenue rose 34% YoY to $28.8M and take‑rate improvements plus higher-margin categories supported profitability.
- Significant Improvement in Adjusted EBITDAAdjusted EBITDA loss narrowed to $8.7M from $13.6M in Q2'25, a 36% year‑over‑year improvement, supporting management's path to Q4'26 breakeven and full‑year adjusted EBITDA profitability in 2027.
- Revenue and High‑Growth Revenue StreamsTotal revenue was $52M, up 14% YoY (15% on a constant currency basis). Marketing & advertising revenue jumped 88% YoY to $3.5M and value‑added services revenue increased 61% YoY to $1.9M, indicating diversification into higher‑margin monetization streams.
- Unit Economics and Fulfillment EfficiencyGross profit per physical goods order increased to $4.9 from $4.8 YoY. Fulfillment cost per physical goods order declined 7% YoY (4% on a constant currency basis) to $2.04, reflecting productivity gains and scale despite temporary surcharges.
- Country‑Level Execution and Strong MarketsNotable country performances: Nigeria physical goods GMV +36% YoY, Kenya +23% YoY, Egypt ~45–50% YoY (strong recovery), Ghana +77% YoY. Upcountry penetration remains strong with 61% of orders from upcountry regions (up from 59% prior quarter).
- Supply Diversification and International SourcingInternational sourcing scaled to 5.8M gross items in Q2, up 96% YoY (adjusted), expanding the Chinese seller base and Turkey apparel supply — helping assortment and competitive pricing.
- Capital Raise and Balance Sheet SupportAnnounced a $50M capital raise anchored by a $25M IFC investment, plus existing and new investor participation — strengthening liquidity and institutional credibility to derisk the path to profitability.
CH:4JMA Earnings History
| Report Date | Fiscal Quarter | Forecast / EPS | Last Year's EPS | EPS YoY Change | Press Release |
|---|---|---|---|---|---|
| Nov 18, 2026 | 2026 (Q3) | -0.06- | -0.07 | ― | ― |
| Aug 12, 2026 | 2026 (Q2) | -0.06-0.06 | -0.1 | 37.50% (+0.04) | |
| May 07, 2026 | 2026 (Q1) | -0.07-0.07 | -0.1 | 29.17% (+0.03) | |
| Feb 10, 2026 | 2025 (Q4) | -0.01-0.08 | -0.12 | 28.57% (+0.03) | |
| Nov 12, 2025 | 2025 (Q3) | -0.07-0.07 | -0.1 | 25.00% (+0.02) | |
| Aug 07, 2025 | 2025 (Q2) | -0.09-0.10 | -0.18 | 44.44% (+0.08) | |
| May 08, 2025 | 2025 (Q1) | ―-0.10 | -0.33 | 70.07% (+0.23) | |
| Feb 20, 2025 | 2024 (Q4) | -0.05-0.12 | -0.14 | 20.45% (+0.03) | |
| Nov 07, 2024 | 2024 (Q3) | ―-0.10 | -0.19 | 46.90% (+0.09) | |
| Aug 06, 2024 | 2024 (Q2) | ―-0.18 | -0.26 | 31.65% (+0.08) |
The table shows recent earnings report dates and whether the forecast was beat or missed. See the change in forecast and EPS from the previous year.