


ARB Corporation earnings date
ARB Corporation (ARBFF) Q4 2026 Earnings Report
ARBFF Q4 2026 EPS Results
- Actual EPS
- $0.38
- Consensus EPS
- $0.36
- Beat/Miss
- Beat by +$0.02
- One Year Ago EPS
- $0.38
ARBFF Q4 2026 Revenue Results
- Actual Revenue
- $239.06M
- Expected Revenue
- $256.69M
- Beat/Miss
- Missed by -$17.63M
- YoY Revenue Growth
- -6.57%
Earnings Announcement Details
- Quarter
- Q4 2026
- Date
- 08/24/2026
- Time
- After Close
- Conference Call
- Monday, August 24, 2026
ARB Corporation 's next earnings date is estimated for February 23, 2027, based on past reporting schedules.
Q4 2026 Earnings Call Audio
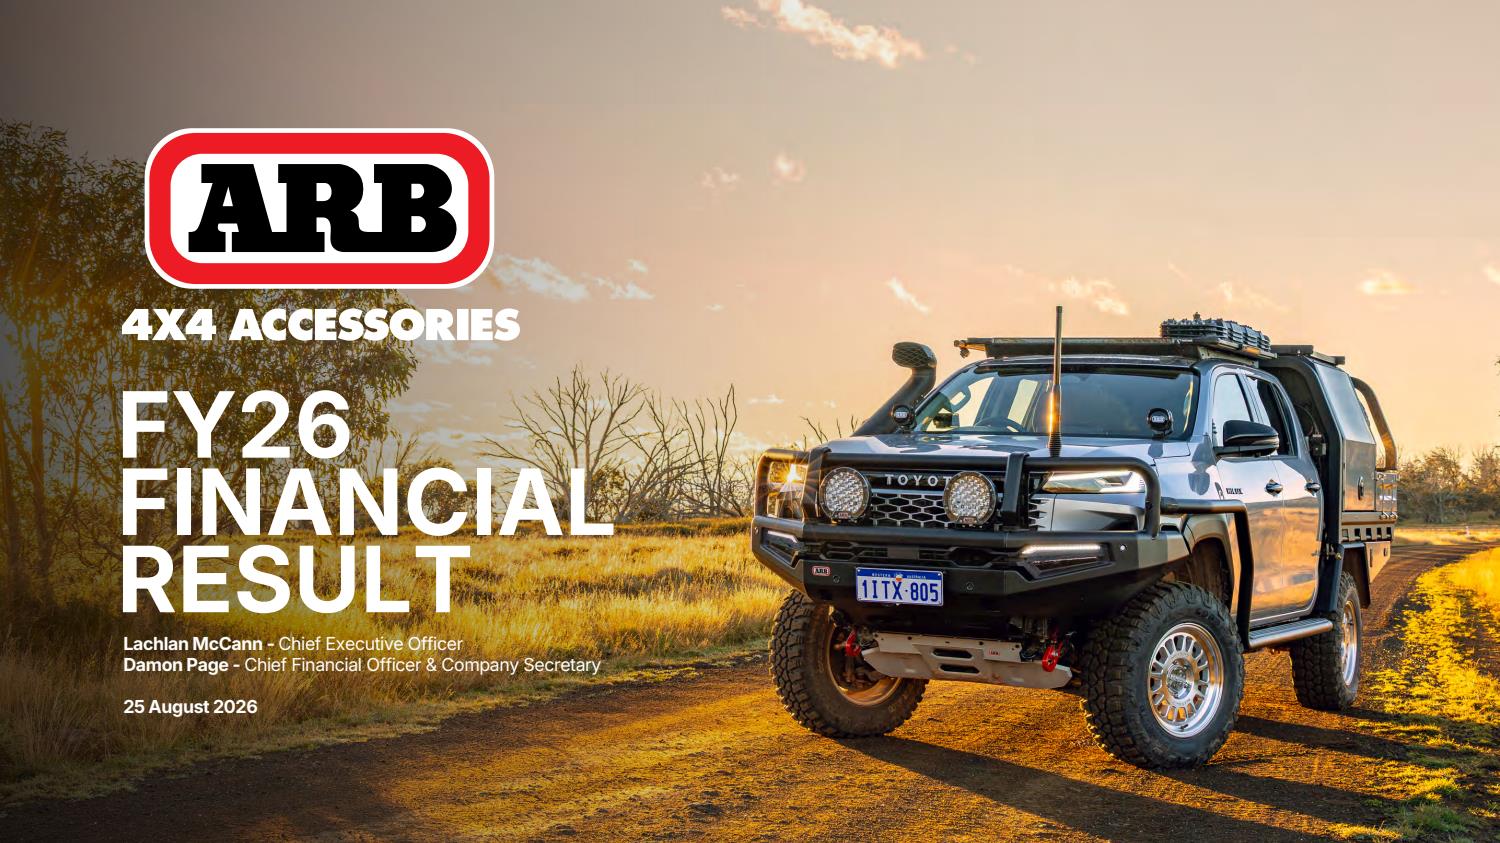
Q4 2026 Earnings Slide Deck
Q4 2026 Earnings Call Summary
The call described a resilient performance amid challenging macro, geopolitical and FX conditions: revenue and underlying profits declined modestly year-on-year, but a clear second-half margin recovery, strong U.S. growth, expanding international footprint (China, South Africa), a debt-free balance sheet, store and digital investments, and planned higher engineering investment point to constructive momentum. Key risks include sensitivity to FX (AUD/THB), cyclical OEM timing, regional conflicts and softer domestic vehicle markets. On balance the positives around recovery, growth initiatives and financial strength outweigh the cyclical and regional headwinds.
Guidance: ARB expects FY27 new-vehicle sales to be broadly in line with FY26 (FY26 sales $702.0m, -3.8%; 10‑yr sales CAGR 7%), with OEM revenues set to recover from FY26’s $43.4m (down 27.2%, 6.2% of group sales) and exports remaining a key growth engine (FY26 export $268.4m, +0.5%; U.S. +13.5% in USD). Management said margins should trade broadly in line with the FY26 average (materials & consumables 42.4% of sales vs 43.3% in FY25; underlying PBT $118.6m, -10.5%; reported PBT $123.0m, -8.9%; PAT $92.4m, -5.2%; EPS $1.11, -5.9%), and will increase engineering investment by c.10–15% p.a. (FY26 R&D expense ~ $20m, capitalised ~$4m; FY26 capex $36.6m — $24.0m property, $12.6m plant). The group is hedged at ~THB23/AUD to Nov 2026, holds $47.9m cash with no debt (net cash down $21.3m after $83.6m of dividends paid) and announced a final fully franked dividend of $0.35 per share; strategic priorities are continued U.S., SE Asia and China expansion, a South Africa wholesale rollout early in FY27, and ongoing store growth (80 stores nationally, targeting 3–5 new stores p.a.).
- Resilient Full-Year FinancialsSales revenue of $702.0M, down 3.8% YoY; profit before tax $123.0M, down 8.9% YoY, and profit after tax $92.4M, down 5.2% YoY — result described as resilient given economic, supply and FX headwinds.
- Strong Second-Half RecoveryFirst half underlying PBT $58.0M (down 16.3%), second half underlying PBT $60.7M (down 4.3%) and reported second-half PBT grew 1.9% YoY, reflecting margin recovery and improving trading shape.
- Export and U.S. GrowthExport sales grew 0.5% to $268.4M (38.2% of group). U.S. sales grew strongly (13.5% in USD terms), driven by wholesale, e-commerce, OEM (RAV4 roof rack) and Poison Spyder relaunch.
- Balance Sheet StrengthCash of $47.9M, no debt; operating cash flow $103.7M; invested $36.6M CapEx; paid $83.6M in fully franked dividends and announced final fully franked dividend $0.35 per share.
- Improved Margins and Cost ManagementMaterials & consumables fell to 42.4% of sales from 43.3% due to a stronger AUD vs THB in H2 and two price increases (≈2% Aug 2025 and ~3.5–4% Feb 2026), supporting gross margin improvement in H2.
- Retail & Customer Experience GainsARB store network expanded to 80 stores including 3 new flagship sites (Townsville flagship 3,527 sqm); NPS improved from average 68 to 75; first dedicated fleet fitting center opened in Auburn NSW.
- Digital and Distribution EnhancementsMigrated Australian website to Adobe e‑commerce platform (#1 visited 4x4 accessory site in Australia), delivering improved customer insights and early direct-to-consumer sales growth; U.S. DC relocated to Norco CA and U.S. engineering center scaled up.
- Strategic Investment in Engineering and International PresenceEngineering investment to increase 10–15% p.a. to accelerate product cadence; new operations launched in China (ARB China Co. Ltd) and South Africa planned (direct wholesale early FY27); won new OEM platform contracts including U.S. customers and Land Cruiser FJ accessories.
ARBFF Earnings History
| Report Date | Fiscal Quarter | Forecast / EPS | Last Year's EPS | EPS YoY Change | Press Release |
|---|---|---|---|---|---|
| Feb 23, 2027 | 2027 (Q2) | 0.36- | 0.36 | ― | ― |
| Aug 24, 2026 | 2026 (Q4) | 0.360.38 | 0.38 | -0.54% (-0.00) | |
| Feb 23, 2026 | 2026 (Q2) | 0.350.36 | 0.42 | -15.06% (-0.06) | |
| Aug 18, 2025 | 2025 (Q4) | 0.410.38 | 0.43 | -11.25% (-0.05) | |
| Feb 17, 2025 | 2025 (Q2) | 0.450.42 | 0.45 | -5.12% (-0.02) | |
| Aug 19, 2024 | 2024 (Q4) | 0.460.43 | 0.35 | 24.15% (+0.08) | |
| Feb 19, 2024 | 2024 (Q2) | 0.440.45 | 0.4 | 11.23% (+0.05) | |
| Aug 21, 2023 | 2023 (Q4) | 0.380.35 | 0.45 | -22.92% (-0.10) | |
| Feb 21, 2023 | 2023 (Q2) | 0.400.40 | 0.59 | -31.48% (-0.18) | |
| Aug 22, 2022 | 2022 (Q4) | 0.660.45 | 0.5 | -10.22% (-0.05) |
The table shows recent earnings report dates and whether the forecast was beat or missed. See the change in forecast and EPS from the previous year.
