

Panasonic (0QYR) Price & Analysis
0QYR Stock Chart & Stats
- Day’s Range
- JPY 3,479.00 - JPY 3,649.00
- 52-Week Range
- JPY 1,700.00 - JPY 4,791.00
- Previous Close
- JPY 3,683.00
- Volume
- 1,400
- Average Volume (3M)
- 1,203
- Market Cap
- JPY 8.28T
- Enterprise Value
- JPY 11.48T
- Total Cash (Recent Filing)
- JPY 761.45B
- Total Debt (Recent Filing)
- JPY 1.59T
- Price to Earnings (P/E)
- 32.7
- Beta
- 0.53
- Next Earnings
- Feb 04, 2027
- Next Dividend Ex-Date
- Mar 30, 2027
- Dividend Yield
- 1.35%
Bulls Say, Bears Say
Bulls Say
Upgraded Earnings Outlook
The upgraded full-year outlook indicates that management sees stronger demand and sufficient operating momentum to lift expected sales and profits. Higher guidance, supported by pricing, restructuring and AI-related growth, improves visibility into earnings over the next several quarters.
AI And Energy Growth
AI infrastructure demand and expanding energy-storage capacity give Panasonic exposure to structural growth markets beyond traditional consumer electronics. Rising AI sales and additional ESS production capacity can broaden the mix toward businesses with stronger long-term demand.
Conservative Balance Sheet
Moderate and improving leverage provides financial resilience across Panasonic's diversified operations. A stronger equity base and lower debt-to-equity ratio support continued investment in batteries, industrial products and capacity expansion while reducing balance-sheet pressure.
Bears Say
Weak Cash Conversion
Positive reported cash flow is weakened by low conversion from earnings and a sharp decline in free cash flow. If this pattern persists, Panasonic may have less internally generated funding for capacity expansion and reduced flexibility when working capital or investment needs rise.
Battery Factory Ramp-up Risk
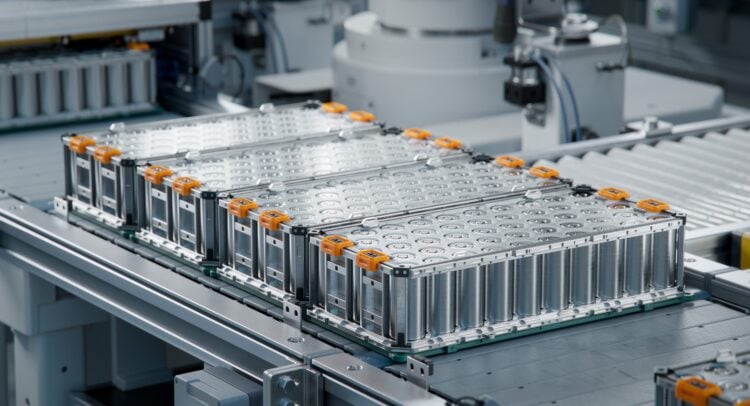
Execution problems at Kansas can delay battery volume growth and leave fixed costs underabsorbed, pressuring the in-vehicle segment's profitability. Although management plans to optimize production with Nevada, the ramp remains an operational constraint over the next several quarters.
Input-cost And Competitive Pressure
Material and logistics inflation directly pressures margins, while aggressive Taiwanese capacity expansion raises competitive risk in circuit materials and capacitors. Panasonic's pricing and expansion actions may offset some effects, but sustained pressure could limit margin improvement.







0QYR FAQ
What was Panasonic’s price range in the past 12 months?
What is Panasonic’s market cap?
When is Panasonic’s upcoming earnings report date?
How were Panasonic’s earnings last quarter?
Is Panasonic overvalued?
Does Panasonic pay dividends?
What is Panasonic’s EPS estimate?
How many shares outstanding does Panasonic have?
What happened to Panasonic’s price movement after its last earnings report?
Which hedge fund is a major shareholder of Panasonic?
What is the TipRanks Smart Score and how is it calculated?
Company Description
Panasonic
Panasonic Holdings Corporation, previously known as Panasonic Corporation, is a global entity that designs, manufactures, markets, and provides support for a broad spectrum of electrical and electronic products. Its business is organized into five key divisions: The Appliances segment encompasses a variety of household goods, such as air conditioners, refrigerators, washing machines, vacuum cleaners, and cooking appliances, alongside personal grooming products, televisions, digital cameras, video and audio equipment, and fixed-line telephones. It also supplies commercial items like display cases, compressors, and fuel cells. The Life Solutions segment focuses on residential and building infrastructure, offering products such as lighting fixtures, wiring devices, solar power systems, spatial air purification/deodorizing equipment, interior/exterior construction materials, ventilation and air conditioning systems, and air purifiers. This segment also includes bicycles, nursing care solutions, and kitchen and bath products. The Connected Solutions segment delivers advanced technological solutions and services. This includes in-flight entertainment and communication systems for aircraft, electronic component mounting machines, welding equipment, robust PCs and tablets, projectors, professional audio-visual systems, and industry-specific solutions. The Automotive segment specializes in vehicle-related technologies, providing infotainment systems, head-up displays, car audio systems, automotive switches, vehicle camera modules, advanced driver assistance systems, and vehicle mirrors. It also produces cylindrical and prismatic lithium-ion batteries, as well as various components and systems for electric automobiles. Finally, the Industrial Solutions segment supplies a comprehensive range of electronic components and devices, including relays, switches, power supply products, industrial motors and sensors, capacitors, coils, resistors, electronic circuit board materials, semiconductors, and LCD panels. Additionally, it offers various small batteries, such as lithium-ion, dry, and micro types. Founded in 1918, Panasonic Holdings Corporation maintains its headquarters in Kadoma, Japan.
- Sector
- Technology
- Industry
- Consumer Electronics
- CEO
- Yuki Kusumi
- Employees
- 183,685
- Website
- holdings.panasonic/global
- Address
- 1006, Oaza Kadoma, Kadoma, OS, 571-8501, JP
Panasonic (0QYR) Earnings & Revenues
0QYR Company Deck
0QYR Earnings Call
Earnings Call SentimentPositive
The call presents a decidedly positive operational picture: record-setting first-quarter operating profit, large year-on-year AOP gains, a 6% sales increase, strong AI- and data-center-related demand, and an upward full-year guidance revision. These positives are tempered by operational ramp-up issues (notably the Kansas factory), material cost headwinds, competitive capacity expansion by rivals, and a still-negative net cash position. Management has clear mitigation plans (capacity expansion, price revisions, production mix optimization) and expects stronger cash generation, indicating confidence in sustaining growth.
View all GB:0QYR earnings summaries0QYR Stock 12 Month Forecast
Average Price Target
Technical Analysis
Overall Consensus
| Indicator | Bullish | Neutral | Bearish |
|---|---|---|---|
| Overall Consensus | 7 | 2 | 13 |
| Technical Analysis | 5 | 2 | 3 |
| Moving Averages | 2 | 0 | 10 |