Working with TipRanks
Follow Us


Stocks
ETFs
Options
Commodities
Crypto
Currency
Pro Newsletters
Research Tools
Calendars
Economic Indicators
Calculators
Education
About Us
Working with TipRanks
Follow Us
Eversource Energy (ES)
NYSE:ES
Holding ES?
Track your performance easily
ES Stock Chart & Stats
Day’s Range$0 - $0
52-Week Range$52.03 - $69.01
Previous Close$66.53
Volume566.99K
Average Volume (3M)2.15M
Market Cap
$23.77B
Enterprise Value$52.46B
Total Cash (Recent Filing)$33.40M
Total Debt (Recent Filing)$28.57B
Price to Earnings (P/E)―
Beta0.44
Next Earnings
Oct 30, 2024EPS Estimate
$1.04Last Dividend Ex-Date
Sep 23, 2024Dividend Yield4.14%
Share Statistics
EPS (TTM)-0.28
Shares Outstanding357,384,733
10 Day Avg. Volume2,149,608
30 Day Avg. Volume2,146,493
Standard Deviation0.07
R-Squared0.24
Alpha-0.00561
Financial Highlights & Ratios
Price to Book (P/B)1.62
Price to Sales (P/S)2.11
Price to Cash Flow (P/CF)8.90
P/FCF Ratio0.00
Enterprise Value/Market CapN/A
Enterprise Value/Revenue4.62
Enterprise Value/Gross Profit10.82
Enterprise Value/Ebitda6.80
Forecast
1Y Price Target
$71.57Price Target Upside7.61% Upside
Rating ConsensusModerate Buy
Number of Analyst Covering10
Eversource Energy News


PremiumCompany Announcements
Eversource Energy Schedules First Half Performance Webcast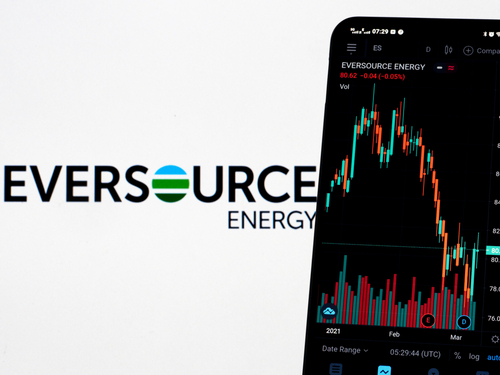

Bulls Say, Bears Say
Bulls Say
Cash ProceedsEversource expects ~$1.1bn of cash proceeds upon closing.
Regulatory EnvironmentConnecticut regulation may be turning the corner, with a tone change from Chairman Gillett and Governor Lamont taking a more proactive role in utility regulations.
Stock ValuationShares currently trade at a ~16% P/E discount to the electric utility group, and shares could re-rate to a low-single-digit discount as the company pays down debt and improves its balance sheet.
Bears Say
Financial PerformanceA weak balance sheet and a need to improve regulatory outcomes in CT are seen as impediments to stock performance.
Project DelaysDelays in its Revolution Wind offshore wind project.
Regulatory ConcernsOngoing concerns about the fraught relationship with PURA temper enthusiasm for ES’s stock performance.
---
Ownership Overview
0.85% Insiders
22.13% Mutual Funds
44.48% Other Institutional Investors
32.53% Public Companies and Individual Investors
Risk Analysis
Main Risk Category
ProductionRisks related to the company’s ability to manufacture goods and services
Website Traffic
 Sorry, No Data Available
There is no website visitor data available for this stock.
---
ES FAQ
What was Eversource Energy’s price range in the past 12 months?
Eversource Energy lowest stock price was $52.03 and its highest was $69.01 in the past 12 months.
What is Eversource Energy’s market cap?
Currently, no data Available
When is Eversource Energy’s upcoming earnings report date?
Eversource Energy’s upcoming earnings report date is Oct 30, 2024 which is in 36 days.
How were Eversource Energy’s earnings last quarter?
Eversource Energy released its earnings results on Jul 31, 2024. The company reported $0.95 earnings per share for the quarter, missing the consensus estimate of $0.955 by -$0.005.
Is Eversource Energy overvalued?
According to Wall Street analysts Eversource Energy’s price is currently Undervalued.
Does Eversource Energy pay dividends?
Eversource Energy pays a Quarterly dividend of $0.71 which represents an annual dividend yield of 4.14%. See more information on Eversource Energy dividends here
What is Eversource Energy’s EPS estimate?
Eversource Energy’s EPS estimate is $1.04.
How many shares outstanding does Eversource Energy have?
Eversource Energy has 357,384,740 shares outstanding.
What happened to Eversource Energy’s price movement after its last earnings report?
Eversource Energy reported an EPS of $0.95 in its last earnings report, missing expectations of $0.955. Following the earnings report the stock price went up 1.791%.
Which hedge fund is a major shareholder of Eversource Energy?
Among the largest hedge funds holding Eversource Energy’s share is Gamco Investors, Inc. ET AL. It holds Eversource Energy’s shares valued at 8M.
---
Eversource Energy Stock Smart Score
Unlock Smart Score
1
2
3
4
5
6
7
8
9
10
Analyst Consensus
Moderate Buy
Average Price Target:
$71.57 (7.61% Upside)
$71.57 (7.61% Upside)
Blogger Sentiment
Bullish
ES Sentiment 88%
Sector Average 70%
Sector Average 70%
Hedge Fund Trend
Decreased
By 45.3K Shares
Last Quarter.
Last Quarter.
Insider Transactions
Sold Shares
Worth $126.0K over
the Last 3 Months
the Last 3 Months
Crowd Wisdom
Very Positive
Last 7 Days >0.1%
Last 30 Days ▲ 4.2%
Last 30 Days ▲ 4.2%
News Sentiment
Neutral
Bullish news 50%
Bearish news 50%
Bearish news 50%
Technicals
SMA
Positive
20 days / 200 days
Momentum
11.26%
12-Months-Change
Fundamentals
Return on Equity
-0.60%
Trailing 12-Months
Asset Growth
6.99%
Trailing 12-Months
Company Description
Eversource Energy
Massachusetts-based Eversource Energy is an electric services company. The company is engaged in the transmission and distribution of electricity, as well as the distribution of natural gas. It also operates regulated water utilities. It operates in four segments: Electric Distribution, Electric Transmission, Natural Gas Distribution, and Water Distribution.
---
ES Company Deck
---
ES Earnings Call
Q2 2024
0:00 / 0:00
---
ES Stock 12 Month Forecast
Average Price Target
$71.57
▲(7.61% Upside)
Technical Analysis
Best Analysts Covering ES
1 Year
1 Year Success Rate
10/16 ratings generated profit
1 Year Average Return
+1.24%
reiterated a buy rating 7 months ago
Copying Shahriar Pourreza's trades and holding each position for 1 Year would result in 62.50% of your transactions generating a profit, with an average return of +1.24% per trade.
---