XRP (XRP-USD) is flashing a familiar technical signal that has historically preceded major rebounds, though traders remain split on whether this scenario can push the token back toward the $5 mark anytime soon.
Elevate Your Investing Strategy:
- Take advantage of TipRanks Premium at 50% off! Unlock powerful investing tools, advanced data, and expert analyst insights to help you invest with confidence.
XRP Price Forms a Hidden Bullish Divergence
XRP has dropped nearly 12% in the past 24 hours, trading as low as $2.23 on Tuesday. Yet, a key pattern on the three-day chart has caught traders’ attention. Analysts have identified a “hidden bullish divergence,” which is a setup that occurs when price forms higher lows while the Relative Strength Index (RSI) prints lower lows.
Historically, this divergence has been followed by strong but short-lived rallies. In early 2022, XRP gained 69% after flashing the same signal. A similar setup appeared between late 2023 and early 2024, leading to a 49% rally before prices cooled again.
“I’d be hoping to hold this range and spring back as the week goes on, but the bias is bearish in the moment,” said the pseudonymous analyst Guy on the Earth, who first pointed out the divergence. “$2.20 is next support with the 2025 major support between $1.90 and $2 next up if we lose this range.”
The $2 zone aligns with both the lower trendline of XRP’s symmetrical triangle pattern and the 1.0 Fibonacci retracement level, making it a critical price level for traders watching for a potential bounce.
XRP Bulls Keep the $5 Target in Sight
Despite the short-term pressure, some traders still see room for a recovery. The upper boundary of XRP’s symmetrical triangle suggests an upside target near $5 in the event of a breakout. This move would represent more than a 100% gain from current prices.
The pattern is fueling cautious optimism among bulls, though history shows that hidden bullish divergences often spark quick bounces rather than full trend reversals. This means XRP could see relief in the coming sessions, but sustaining a longer rally will likely depend on broader market sentiment and potential ETF-driven demand in the months ahead.
$695 Million in XRP Shorts Could Face a Squeeze
Derivatives data points to another possible catalyst, which is an overcrowded short market. According to CoinGlass, XRP currently has over $695 million in leveraged short positions compared with just $32 million in longs.
Most of that short liquidity sits between $2.60 and $3.50, suggesting that even a modest rebound could trigger a short squeeze, forcing bears to cover positions and accelerating price gains. Meanwhile, there’s minimal long exposure below $2.16, meaning much of the selling pressure may have already played out after October’s drop.
At the moment, the situation looks precarious but promising. XRP’s downside risk appears limited in the near term, and if price climbs into that short-heavy zone, volatility could surge fast, giving the “hidden bullish divergence” one more chance to prove its power.
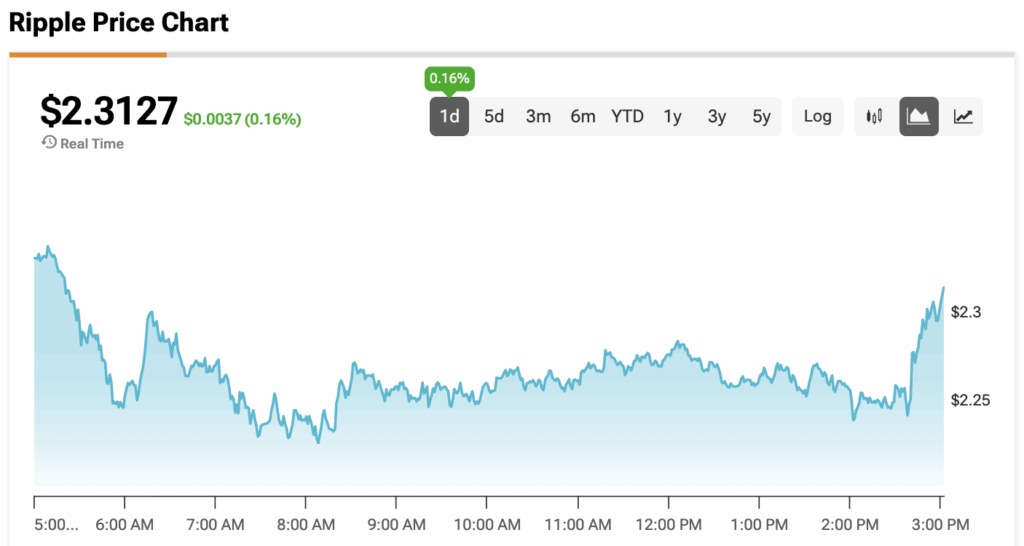
At the time of writing, XRP is sitting at $2.3127.