


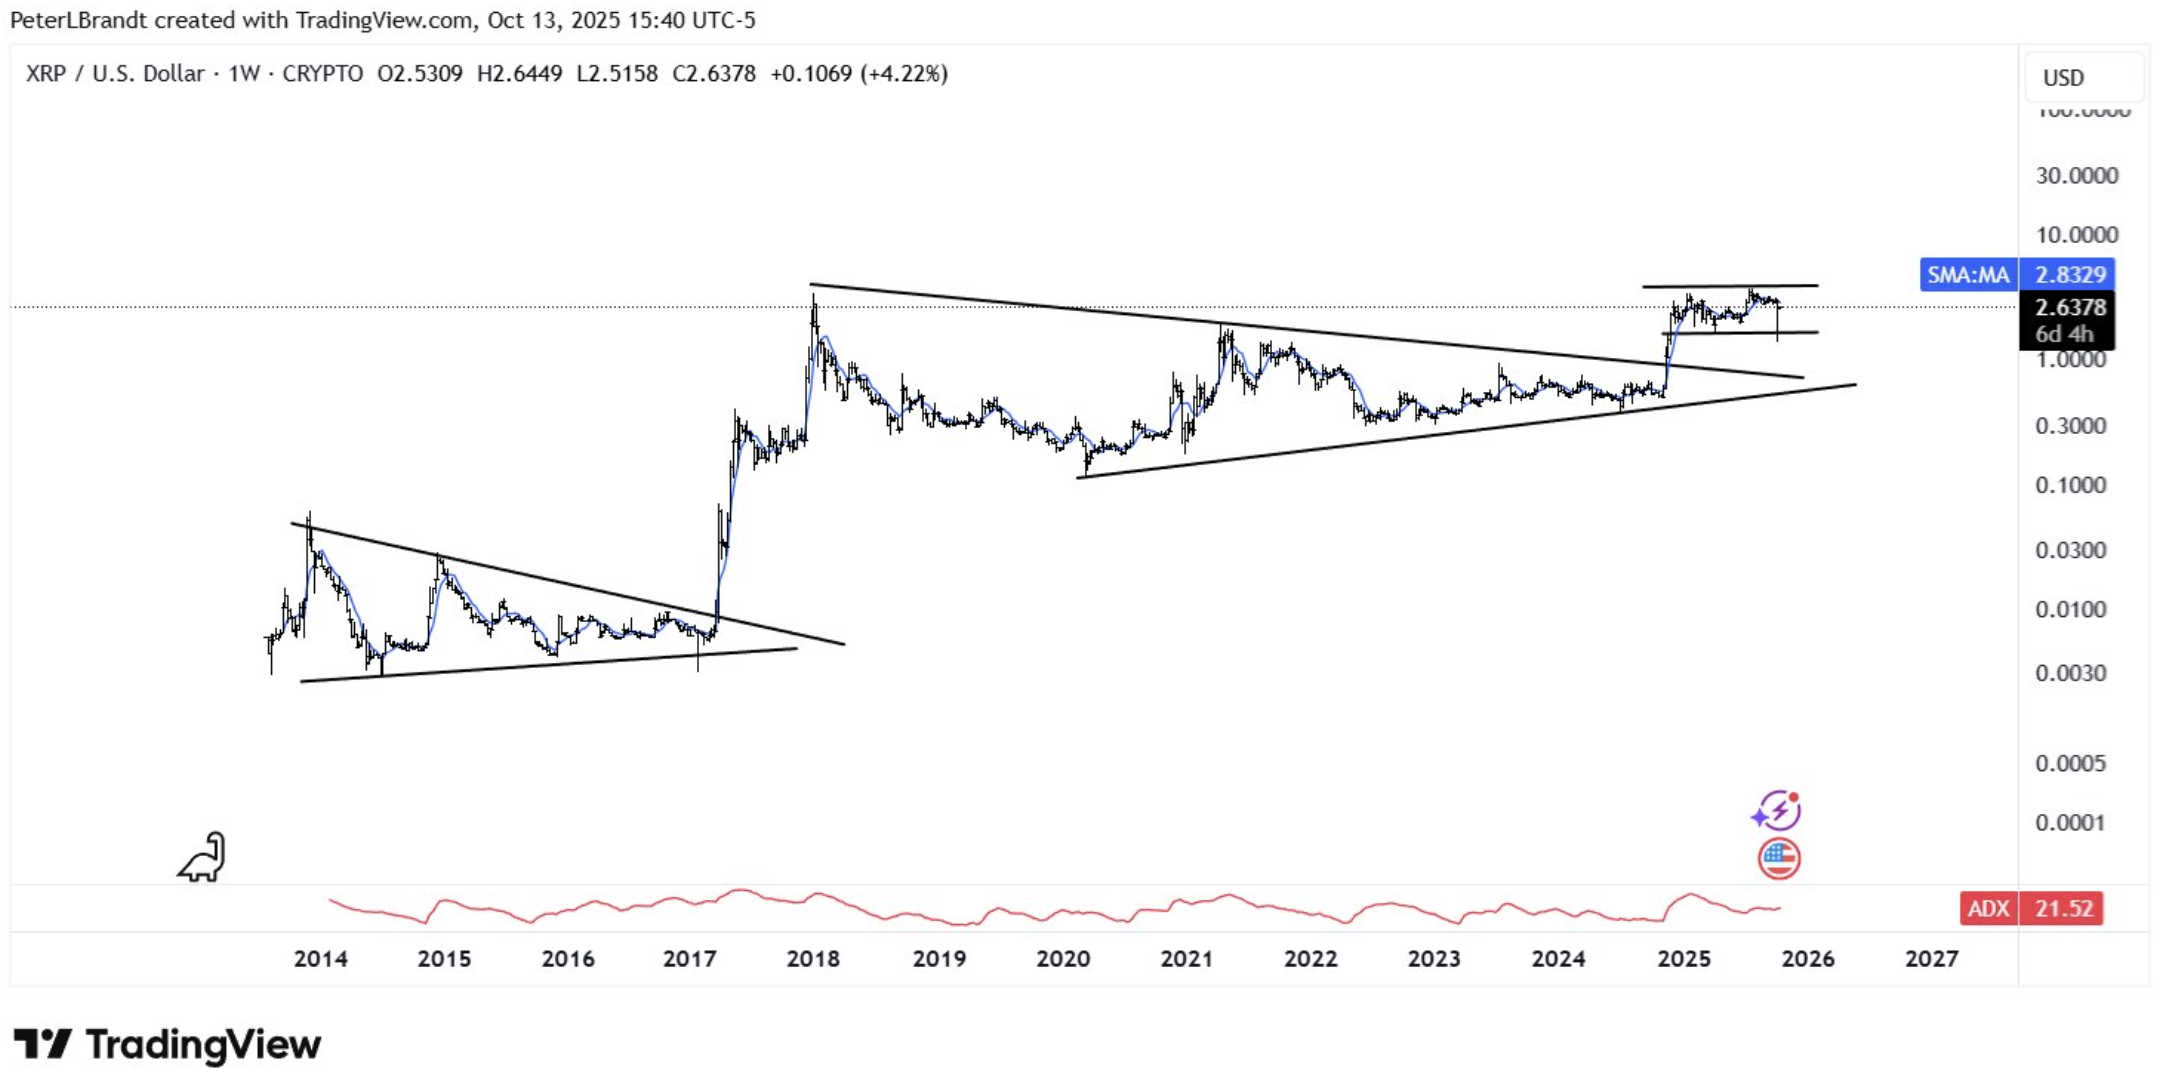
XRP (XRP-USD) caught the attention of one of the market’s most respected chart analysts this week. Peter Brandt, a veteran trader known for his classical charting style and four decades of market experience, shared a weekly price chart of XRP, calling it a textbook example of long-term structure.
Elevate Your Investing Strategy:
- Take advantage of TipRanks Premium at 50% off! Unlock powerful investing tools, advanced data, and expert analyst insights to help you invest with confidence.
“As a student of classical charting principles and history, has there ever been a purer long-term chart?” Brandt wrote on X, alongside a chart showing XRP’s decade-long price action.
The chart highlights two symmetrical triangle formations that have defined XRP’s major cycles since 2013. The first preceded XRP’s explosive rally to nearly $3.40 in early 2018, while the second appears to be forming a similar setup in the current market structure.
Brandt’s post quickly circulated across crypto circles, sparking discussion among traders who view the token’s multi-year consolidation as a sign of brewing momentum.
Chart Structure Strengthens Long-Term Case
XRP’s current formation shows tightening price action between converging support and resistance levels, a pattern traders often interpret as a prelude to a breakout. Historically, similar patterns on XRP’s chart have signaled the beginning of large rallies once volume and momentum confirmed the move.
Moreover, XRP has been trading above its 200-week moving average for several months, suggesting sustained long-term support. Analysts say the token’s ability to hold that level through recent market volatility reflects renewed investor confidence following its 66% recovery from October’s lows.
Brandt’s reference to “classical charting principles” points to an approach grounded in historical market behavior. These setups, often seen in commodities and equities before large expansions, rely on the assumption that price history repeats itself through psychological and structural patterns.
XRP Traders Focus on Key Resistance Levels
Despite the optimism, XRP still faces critical resistance between $2.70 and $3.00, where past rallies have struggled to hold. A confirmed breakout above this range could trigger the next leg higher, potentially mirroring the 2017–2018 price surge that followed a similar pattern.
Technical analysts caution, however, that false breakouts remain possible. Trading volumes and market-wide sentiment will be key factors in confirming whether XRP can sustain an upward move.
Still, Brandt’s endorsement carries weight among traders who prioritize long-term technical setups over short-term speculation. His comments have added a sense of legitimacy to a chart that many had dismissed during the prolonged consolidation phase.
XRP’s Broader Narrative Gains Momentum
Beyond technicals, XRP’s renewed strength comes amid growing institutional interest in blockchain payment solutions. Ripple’s ongoing partnerships with global financial institutions and its testing of XRP Ledger integrations for tokenized assets have reinforced its use case beyond retail speculation.
In addition, recent macro developments, including easing trade tensions and a rebound in broader crypto markets, have supported risk appetite and liquidity flows into large-cap tokens like XRP.
Patience Becomes the Strategy for Traders
For traders following Brandt’s analysis, XRP’s chart reflects a cycle of accumulation, patience, and potential breakout. This is a pattern that historically rewards those who wait for confirmation rather than chase volatility.
Brandt’s rhetorical question, “Has there ever been a purer long-term chart?” encapsulates both the symmetry of XRP’s historical structure and the psychology of markets that repeat over time.
Whether XRP fulfills that setup remains to be seen, but for technical purists, it may already have earned a rare distinction, one of the most elegant price charts in modern crypto history.
At the time of writing, XRP is sitting at $2.4286.
