


Apple (AAPL) shares lost steam after reporting its fiscal second-quarter earnings in early May, dropping as much as 7% in the hours following the announcement. While Apple delivered a solid beat across the board, it couldn’t overcome ongoing concerns like a crippling iPhone sales decline in China, which were already down 9% annually even before trade tensions escalated.
Meet Your ETF AI Analyst
- Discover how TipRanks' ETF AI Analyst can help you make smarter investment decisions
- Explore ETFs TipRanks' users love and see what insights the ETF AI Analyst reveals about the ones you follow.
Not even the massive $100 billion share buyback lifted the stock. In my view, the key reason is simple: Apple looks overvalued, which makes it more vulnerable to corrections when uncertainty ramps up.

To better explain why I’m currently skeptical of Apple’s stock, mainly due to its valuation, a grounded analysis that discounts future cash flows from its two main business lines might offer a clearer picture of why I see Apple as a Hold right now.
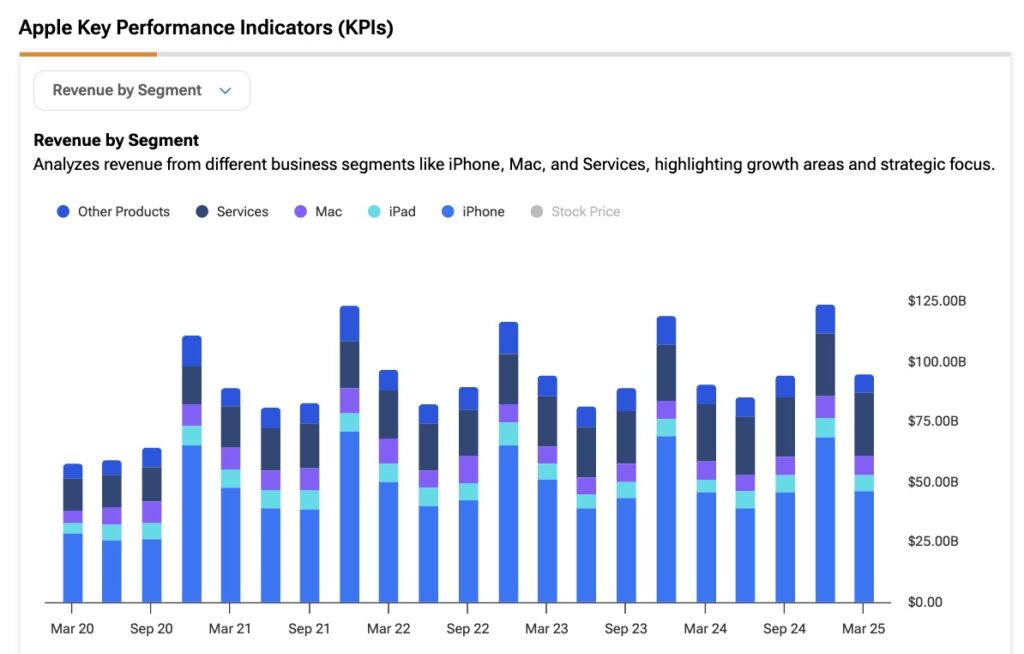
Apple’s business essentially breaks down into two major segments: products, including all its hardware like the iPhone, Mac, and wearables. And services, with the App Store and iCloud leading the way—this segment is by far the more profitable part of Apple’s business. Given that split, I think it makes sense to evaluate the company with this structure in mind. A sum-of-the-parts valuation could be especially useful here.
How Apple’s Product Business Measures Up
Apple’s product segment mainly includes its flagship product, the iPhone, which is the core of its ecosystem. Over the last six months, this segment accounted for about 75% of the nearly $220 billion in total revenue. Apple products typically run on tighter margins—around 37.9% over the last two quarters—compared to the 75.4% margins seen in services.
More broadly, products are a lower-quality business than services, not just because of the slimmer margins but also because sales and earnings are less predictable and tend to fluctuate with product cycles. For instance, Apple heavily outsources its manufacturing and assembly to third parties in Taiwan and China, exposing it to tariffs.
This makes the segment vulnerable to trade war shocks, which can cause fluctuations in the cost of sales (COGS). For example, in Q2, COGS in the products division increased by 10%, rising to $44 billion from $42.4 billion a year earlier. At the same time, revenues inched up from $66.8 billion to $68.7 billion, a modest 2.7% year-over-year, significantly trailing the pace of COGS growth.
Even so, in an attempt to estimate a fair value for Apple’s product business using the discounted cash flow method, I think it’s reasonable to project a 5% annual growth in product sales over the next five years, starting with the $295 billion reported in Fiscal 2024. While growth may fluctuate, I believe the iPhone’s strong competitive edge and the potential for AI-driven upgrade cycles will help maintain healthy demand for the next few years.

On profitability, a typical operating expenses (OpEx) ratio of around 15–20% of revenue suggests that operating margins could stabilize around 21%. However, they’ve ticked higher recently due to a larger mix of premium products (like the iPhone Pro and iPhone Pro Max). As for working capital, I’m assuming no major changes in cash flow, even though Apple has generated additional cash flow in line with its history of tight inventory management.
Applying a 3% perpetual growth rate and a conservative 10% discount rate—reflecting the segment’s slower growth and higher risk—I estimate the equity value of Apple’s products business at roughly $1.05 trillion.
Services Cash Cow Fuels Apple’s Ecosystem
Not only is services Apple’s most profitable segment, but it’s also become increasingly important to its overall revenue mix. Over the past six months, services contributed 25% of total revenue, up from 24% in 2024 and 22% in 2023. Thanks to its reliance on recurring revenue streams, the segment provides much more stability and predictability regarding cash flow generation than products.
Key offerings like the App Store and iCloud also benefit from being highly scalable. Even though they may require significant investment to run, each additional dollar of revenue brings minimal marginal cost, meaning more of it flows straight to the bottom line.
In Q2, for example, Services revenue grew 12% to $26.6 billion, up from $23.8 billion in the same quarter last year. Meanwhile, the cost of sales rose only 6.7%, from $6 billion to $6.4 billion—another sign of strong operating leverage.
Applying the same exercise to estimate the segment’s value based on its cash flow generation, I’m assuming the services segment continues growing at a 12% annual rate, in line with recent performance, starting from the $96 billion it generated in FY2024. Regarding profitability, with gross margins at 75.4%, I think it’s reasonable to assume operating margins of 45% for FY2025, expanding by 100 basis points annually through the end of FY2029.

Even assuming the same 3% perpetual growth rate used for the products segment, the services business deserves a lower discount rate, given its more stable and resilient profile. In this case, I’m using a 7% discount rate—roughly 2.5% points above the 10-year Treasury yield.
Based on these assumptions, I estimate the intrinsic value of Apple’s Services segment to be around $1.62 trillion. Combined with the Products segment, this implies a total equity value for Apple of approximately $2.67 trillion, roughly 9.5% below its current market value.
Is Apple a Buy, Sell, or Hold?
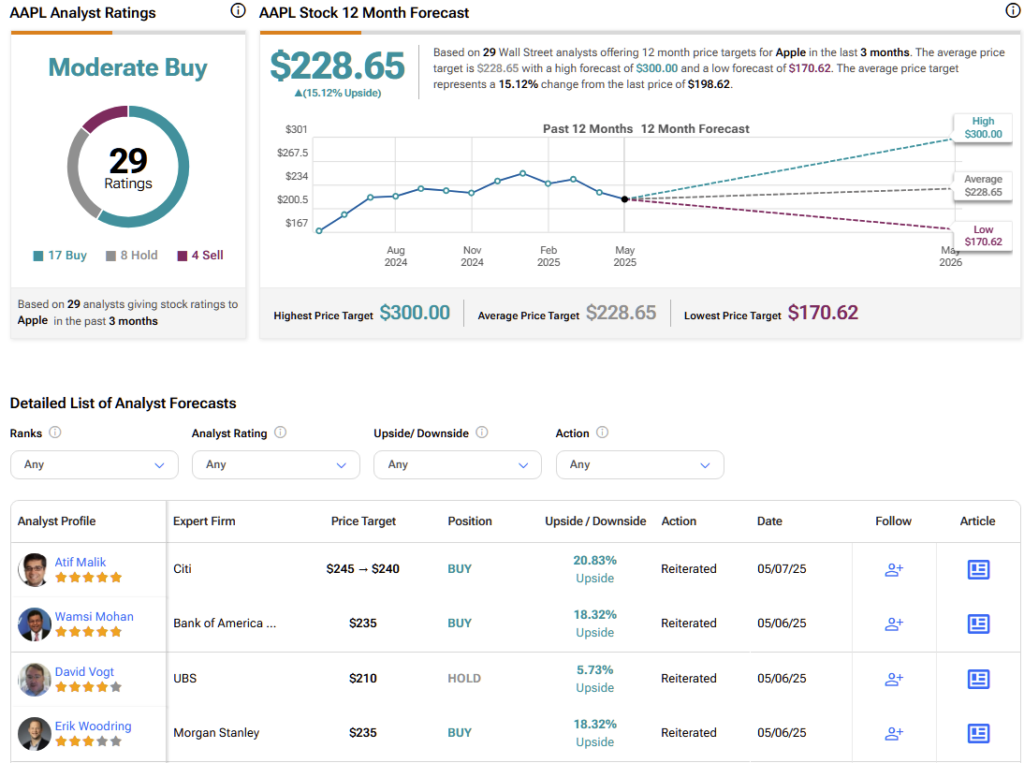
Most analysts remain bullish on Apple, but there’s a bit of caution in the mix. Of the 29 analysts covering the stock, 17 are bullish, eight are neutral, and four are bearish. The average price target is $228.65, suggesting about 15% upside from the current price over the coming year.
Dwindling Breathing Room for Apple Stock
Apple has some of the strongest business fundamentals in the tech world, but it’s also a stock that’s arguably priced for perfection. When risks arise—like a trade war affecting sales in China—those high valuations become even more apparent.
Even with fairly optimistic growth assumptions, it’s hard to find a solid margin of safety for going long on Apple right now. Based on how the stock has corrected throughout the year, the market seems to share the same view.