


- Fourth-quarter net income rises sharply on net sales gain of 40%, demonstrating strong execution in face of continued supply-chain constraints.
- Market environment bolstered by favorable industry fundamentals and continuation of strong demand for farm and construction equipment.
- Full-year 2023 forecast calls for higher sales and net income of $8.0 to $8.5 billion.
MOLINE, Ill., Nov. 23, 2022 /PRNewswire/ — Deere & Company (NYSE: DE) reported net income of $2.246 billion for the fourth quarter ended October 30, 2022, or $7.44 per share, compared with net income of $1.283 billion, or $4.12 per share, for the quarter ended October 31, 2021. For fiscal-year 2022, net income attributable to Deere & Company was $7.131 billion, or $23.28 per share, compared with $5.963 billion, or $18.99 per share, in fiscal 2021.
Meet Your ETF AI Analyst
- Discover how TipRanks' ETF AI Analyst can help you make smarter investment decisions
- Explore ETFs TipRanks' users love and see what insights the ETF AI Analyst reveals about the ones you follow.
Worldwide net sales and revenues increased 37 percent, to $15.536 billion, for the fourth quarter of fiscal 2022 and rose 19 percent, to $52.577 billion, for the full year. Equipment operations net sales were $14.351 billion for the quarter and $47.917 billion for the year, compared with corresponding totals of $10.276 billion and $39.737 billion in 2021.
“Deere’s strong performance for both the fourth quarter and full year is a tribute to our dedicated team of employees, dealers, and suppliers throughout the world,” said John C. May, chairman and chief executive officer. “We’re proud of their extraordinary efforts to overcome supply-chain constraints, increase factory production, and deliver products to our customers.”
Company Outlook & Summary
Net income attributable to Deere & Company for fiscal 2023 is forecast to be in a range of $8.0 billion to $8.5 billion.
“Deere is looking forward to another strong year in 2023 based on positive farm fundamentals and fleet dynamics as well as an increased investment in infrastructure,” May said. “These factors are expected to support healthy demand for our equipment. At the same time, we have confidence in the smart industrial operating model and our ability to deliver solutions that help our customers be more profitable, productive, and sustainable.”
|
Deere & Company |
Fourth Quarter |
Full Year |
|||||||||||||||
|
$ in millions, except per share amounts |
2022 |
2021 |
% Change |
2022 |
2021 |
% Change |
|||||||||||
|
Net sales and revenues |
$ |
15,536 |
$ |
11,327 |
37 % |
$ |
52,577 |
$ |
44,024 |
19 % |
|||||||
|
Net income |
$ |
2,246 |
$ |
1,283 |
75 % |
$ |
7,131 |
$ |
5,963 |
20 % |
|||||||
|
Fully diluted EPS |
$ |
7.44 |
$ |
4.12 |
$ |
23.28 |
$ |
18.99 |
|||||||||
Results for the periods shown were affected by special items. See Note 1 of the financial statements for further details.
|
Production & Precision Agriculture |
Fourth Quarter |
||||||||
|
$ in millions |
2022 |
2021 |
% Change |
||||||
|
Net sales |
$ |
7,434 |
$ |
4,661 |
59 % |
||||
|
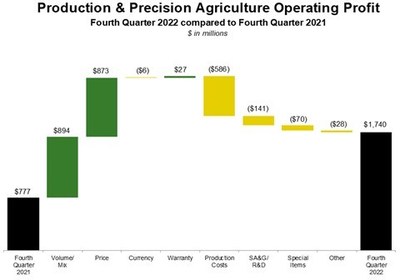
Operating profit |
$ |
1,740 |
$ |
777 |
124 % |
||||
|
Operating margin |
23.4 % |
16.7 % |
|||||||
Production and precision agriculture sales increased for the quarter due to higher shipment volumes and price realization. Operating profit rose primarily due to improved shipment volumes / mix and price realization. These items were partially offset by higher production costs, higher R&D and SA&G expenses, and the impact of higher reserves on the remaining assets in Russia.
|
Small Agriculture & Turf |
Fourth Quarter |
||||||||
|
$ in millions |
2022 |
2021 |
% Change |
||||||
|
Net sales |
$ |
3,544 |
$ |
2,809 |
26 % |
||||
|
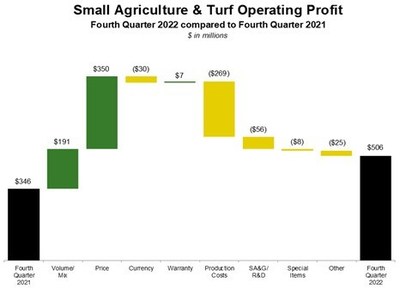
Operating profit |
$ |
506 |
$ |
346 |
46 % |
||||
|
Operating margin |
14.3 % |
12.3 % |
|||||||
Small agriculture and turf sales increased for the quarter due to higher shipment volumes and price realization, partially offset by the negative effects of currency translation. Operating profit rose primarily due to price realization and improved shipment volumes / mix. These items were partially offset by higher production costs, higher R&D and SA&G expenses, and the unfavorable effects of foreign exchange.
|
Construction & Forestry |
Fourth Quarter |
||||||||
|
$ in millions |
2022 |
2021 |
% Change |
||||||
|
Net sales |
$ |
3,373 |
$ |
2,806 |
20 % |
||||
|
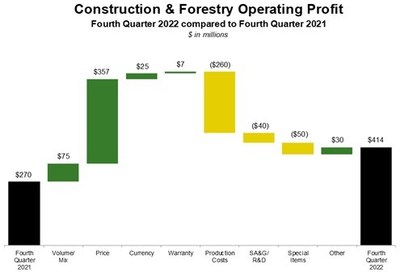
Operating profit |
$ |
414 |
$ |
270 |
53 % |
||||
|
Operating margin |
12.3 % |
9.6 % |
|||||||
Construction and forestry sales moved higher for the quarter primarily due to price realization and higher shipment volumes, partially offset by the negative effects of currency translation. Operating profit improved mainly due to price realization and higher sales volume. Partially offsetting these factors were increases in production costs and the impact of higher reserves on the remaining assets in Russia.
|
Financial Services |
Fourth Quarter |
||||||||
|
$ in millions |
2022 |
2021 |
% Change |
||||||
|
Net income |
$ |
232 |
$ |
227 |
2 % |
||||
Financial services net income for the quarter rose mainly due to income earned on a higher average portfolio partially offset by less-favorable financing spreads. The provision for credit losses increased, reflecting economic uncertainty in Russia. Financial services received an intercompany benefit from the equipment operations, which guarantees financial services’ investments in certain international markets, including Russia.
|
Industry Outlook for Fiscal 2023 |
|||||||
|
Agriculture & Turf |
|||||||
|
U.S. & Canada: |
|||||||
|
Large Ag |
Up 5 to 10% |
||||||
|
Small Ag & Turf |
Flat to Down 5% |
||||||
|
Europe |
Flat to Up 5% |
||||||
|
South America (Tractors & Combines) |
Flat to Up 5% |
||||||
|
Asia |
Down moderately |
||||||
|
Construction & Forestry |
|||||||
|
U.S. & Canada: |
|||||||
|
Construction Equipment |
Flat to Up 5% |
||||||
|
Compact Construction Equipment |
Flat to Up 5% |
||||||
|
Global Forestry |
~ Flat |
||||||
|
Global Roadbuilding |
~ Flat |
|
Deere Segment Outlook for Fiscal 2023 |
Currency |
Price |
|||||
|
$ in millions |
Net Sales |
Translation |
Realization |
||||
|
Production & Precision Ag |
Up 15 to 20% |
-1 % |
+11 % |
||||
|
Small Ag & Turf |
Flat to Up 5% |
-2 % |
+7 % |
||||
|
Construction & Forestry |
Up ~ 10% |
-1 % |
+8 % |
||||
|
Financial Services |
Net Income |
$900 |
|||||
Financial Services. Fiscal-year 2023 net income attributable to Deere & Company for the financial services operations is forecast to be $900 million. Results are expected to be slightly higher in fiscal 2023 due to income earned on a higher average portfolio, partially offset by less-favorable financing spreads and lower gains on operating-lease residual values. Excluding the portfolio in Russia, a higher provision for credit losses is forecast for 2023.
John Deere Capital Corporation
The following is disclosed on behalf of the company’s financial services subsidiary, John Deere Capital Corporation (JDCC), in connection with the disclosure requirements applicable to its periodic issuance of debt securities in the public market.
|
Fourth Quarter |
Full Year |
||||||||||||||||
|
$ in millions |
2022 |
2021 |
% Change |
2022 |
2021 |
% Change |
|||||||||||
|
Revenue |
$ |
776 |
$ |
673 |
15 % |
$ |
2,759 |
$ |
2,688 |
3 % |
|||||||
|
Net income |
$ |
184 |
$ |
181 |
2 % |
$ |
704 |
$ |
711 |
-1 % |
|||||||
|
Ending portfolio balance |
$ |
47,228 |
$ |
41,488 |
14 % |
||||||||||||
Net income for the fourth quarter of fiscal 2022 was higher than in the previous fourth quarter primarily due to income earned on higher average portfolio balances, partially offset by less-favorable financing spreads. Full-year 2022 net income moved lower than 2021 due to less-favorable financing spreads, a higher provision for credit losses, higher SA&G expenses, and unfavorable discrete income-tax adjustments. These factors were partially offset by income earned on a higher average portfolio.
FORWARD-LOOKING STATEMENTS
Certain statements contained herein, including in the sections entitled “Company Outlook & Summary,” “Industry Outlook for Fiscal 2023,” and “Deere Segment Outlook for Fiscal 2023,” relating to future events, expectations, and trends constitute “forward-looking statements” as defined in the Private Securities Litigation Reform Act of 1995 and involve factors that are subject to change, assumptions, risks, and uncertainties that could cause actual results to differ materially. Some of these risks and uncertainties could affect all lines of the company’s operations generally while others could more heavily affect a particular line of business.
Forward-looking statements are based on currently available information and current assumptions, expectations, and projections about future events and should not be relied upon. Except as required by law, the company expressly disclaims any obligation to update or revise its forward-looking statements. Further information concerning the company and its businesses, including factors that could materially affect the company’s financial results, is included in the company’s other filings with the SEC (including, but not limited to, the factors discussed in Item 1A. “Risk Factors” of the company’s most recent Annual Report on Form 10-K and subsequent Quarterly Reports on Form 10-Q).
Factors Affecting All Lines of Business
All of the company’s businesses and their results are affected by general global macroeconomic conditions, including but not limited to inflation, including rising costs for materials used in our production, slower growth or recession, higher interest rates and currency fluctuations which could adversely affect the U.S. dollar and customer confidence, customer access to capital, and overall demand for our products; delays or disruptions in the company’s supply chain, including work stoppages or disputes by suppliers with their unionized labor; shipping delays; government spending and taxing; changes in weather and climate patterns; the political and social stability of the markets in which the company operates; the effects of, or response to, wars and other conflicts, including the current conflict between Russia and Ukraine; natural disasters; and the spread of major epidemics or pandemics (including the COVID-19 pandemic).
Significant changes in market liquidity conditions, changes in the company’s credit ratings, and any failure to comply with financial covenants in credit agreements could impact our access to or terms of future funding, which could reduce the company’s earnings and cash flows. A debt crisis in Europe (including the recent volatility of the United Kingdom’s bond market), Latin America, or elsewhere could negatively impact currencies, global financial markets, funding sources and costs, asset and obligation values, customers, suppliers, and demand for equipment. The company’s investment management activities could be impaired by changes in the equity, bond, and other financial markets, which would negatively affect earnings.
Additional factors that could materially affect the company’s operations, financial condition, and results include changes in governmental trade, banking, monetary, and fiscal policies, including policies and tariffs for the benefit of certain industries or sectors; actions by environmental, health, and safety regulatory agencies, including those related to engine emissions, carbon and other greenhouse gas emissions, and the effects of climate change; changes to GPS radio frequency bands and their permitted uses; speed of research and development; effectiveness of partnerships with third parties; the dealer channel’s ability to support and service precision technology solutions; changes to accounting standards; changes to and compliance with economic sanctions and export controls laws and regulations (including those in place for Russia); and compliance with evolving U.S. and foreign laws when expanding to new markets and otherwise.
Other factors that could materially affect the company’s results and operations include security breaches, cybersecurity attacks, technology failures, and other disruptions to the information technology infrastructure of the company and its suppliers and dealers; security breaches with respect to the company’s products; the loss of or challenges to intellectual property rights; the availability and prices of strategically sourced materials, components, and whole goods; introduction of legislation that could affect the company’s business model and intellectual property, such as so-called right to repair or right to modify legislation; events that damage the company’s reputation or brand; significant investigations, claims, lawsuits, or other legal proceedings; the success or failure of new product initiatives or business strategies; changes in product preferences, sales mix, and take rates of products and life cycle solutions; gaps or limitations in rural broadband coverage, capacity, and speed needed to support technology solutions; oil and energy prices, supplies, and volatility; the availability and cost of freight; actions of competitors in the various industries in which the company competes, particularly price discounting; dealer practices, especially as to levels of new and used field inventories; changes in demand and pricing for used equipment and resulting impacts on lease residual values; the inability to deliver precision technology and agricultural solutions to customers; labor relations and contracts, including work stoppages and other disruptions; changes in the ability to attract, develop, engage, and retain qualified personnel; and the integration of acquired businesses.
Production & Precision Agriculture and Small Agriculture & Turf Operations
The company’s agricultural equipment operations are subject to a number of uncertainties, including customer profitability; consumer purchasing preferences; housing starts and supply; infrastructure investment; and consumable input costs. Additionally, these operations are subject to certain factors that affect farmers’ confidence and financial condition. These factors include demand for agricultural products; world grain stocks; soil conditions; harvest yields; prices for commodities and livestock; availability and cost of fertilizer; availability of transport for crops; the growth and sustainability of non-food uses for some crops (including ethanol and biodiesel production); real estate values; availability of technological innovations; available acreage for farming; changes in government farm programs and policies; changes in and effects of crop insurance programs; changes in environmental regulations and their impact on farming practices; animal diseases and their effects on poultry, beef, and pork consumption and prices on livestock feed demand; and crop pests and diseases.
Production and Precision Agriculture Operations
In addition to the uncertainties discussed above, the production and precision agriculture operations rely in part on hardware and software, guidance, connectivity and digital solutions, and automation and machine intelligence. Many factors contribute to the company’s precision agriculture sales and results, including the impact to customers’ profitability and/or sustainability outcomes.
Small Agriculture and Turf Equipment
In addition to the uncertainties discussed above, factors affecting the company’s small agriculture and turf equipment operations include spending by municipalities and golf courses.
Construction and Forestry
Factors affecting the company’s construction and forestry equipment operations include real estate and housing prices; the number of housing starts; commodity prices such as oil and gas; the levels of public and non-residential construction; and investment in infrastructure, while prices for pulp, paper, lumber, and structural panels affect sales of forestry equipment.
John Deere Financial
The liquidity and ongoing profitability of John Deere Capital Corporation and the company’s other financial services subsidiaries depend on timely access to capital to meet future cash flow requirements, and to fund operations, costs, and purchases of the company’s products. If general economic conditions deteriorate further or capital markets become more volatile, funding could be unavailable or insufficient. Additionally, customer confidence levels may result in declines in credit applications and increases in delinquencies and default rates, which could materially impact write-offs and provisions for credit losses.
|
DEERE & COMPANY |
||||||||||||||||
|
Three Months Ended |
Years Ended |
|||||||||||||||
|
October 30 |
October 31 |
% |
October 30 |
October 31 |
% |
|||||||||||
|
2022 |
2021 |
Change |
2022 |
2021 |
Change |
|||||||||||
|
Net sales and revenues: |
||||||||||||||||
|
Production & precision ag net sales |
$ |
7,434 |
$ |
4,661 |
+59 |
$ |
22,002 |
$ |
16,509 |
+33 |
||||||
|
Small ag & turf net sales |
3,544 |
2,809 |
+26 |
13,381 |
11,860 |
+13 |
||||||||||
|
Construction & forestry net sales |
3,373 |
2,806 |
+20 |
12,534 |
11,368 |
+10 |
||||||||||
|
Financial services revenues |
988 |
869 |
+14 |
3,625 |
3,548 |
+2 |
||||||||||
|
Other revenues |
197 |
182 |
+8 |
1,035 |
739 |
+40 |
||||||||||
|
Total net sales and revenues |
$ |
15,536 |
$ |
11,327 |
+37 |
$ |
52,577 |
$ |
44,024 |
+19 |
||||||
|
Operating profit: * |
||||||||||||||||
|
Production & precision ag |
$ |
1,740 |
$ |
777 |
+124 |
$ |
4,386 |
$ |
3,334 |
+32 |
||||||
|
Small ag & turf |
506 |
346 |
+46 |
1,949 |
2,045 |
-5 |
||||||||||
|
Construction & forestry |
414 |
270 |
+53 |
2,014 |
1,489 |
+35 |
||||||||||
|
Financial services |
297 |
299 |
-1 |
1,159 |
1,144 |
+1 |
||||||||||
|
Total operating profit |
2,957 |
1,692 |
+75 |
9,508 |
8,012 |
+19 |
||||||||||
|
Reconciling items ** |
(68) |
(79) |
-14 |
(370) |
(391) |
-5 |
||||||||||
|
Income taxes |
(643) |
(330) |
+95 |
(2,007) |
(1,658) |
+21 |
||||||||||
|
Net income attributable to |
$ |
2,246 |
$ |
1,283 |
+75 |
$ |
7,131 |
$ |
5,963 |
+20 |
||||||
|
* |
Operating profit is income from continuing operations before corporate expenses, certain external interest expense, certain foreign exchange gains and losses, and income taxes. Operating profit of the financial services segment includes the effect of interest expense and foreign exchange gains or losses. |
|
** |
Reconciling items are primarily corporate expenses, certain external interest expense, certain foreign exchange gains and losses, pension and postretirement benefit costs excluding the service cost component, and net income attributable to noncontrolling interests. |
|
DEERE & COMPANY |
||||||||||||
|
Three Months Ended |
Years Ended |
|||||||||||
|
2022 |
2021 |
2022 |
2021 |
|||||||||
|
Net Sales and Revenues |
||||||||||||
|
Net sales |
$ |
14,351 |
$ |
10,276 |
$ |
47,917 |
$ |
39,737 |
||||
|
Finance and interest income |
925 |
828 |
3,365 |
3,296 |
||||||||
|
Other income |
260 |
223 |
1,295 |
991 |
||||||||
|
Total |
15,536 |
11,327 |
52,577 |
44,024 |
||||||||
|
Costs and Expenses |
||||||||||||
|
Cost of sales |
10,214 |
7,809 |
35,338 |
29,116 |
||||||||
|
Research and development expenses |
576 |
450 |
1,912 |
1,587 |
||||||||
|
Selling, administrative and general expenses |
1,192 |
936 |
3,863 |
3,383 |
||||||||
|
Interest expense |
348 |
210 |
1,062 |
993 |
||||||||
|
Other operating expenses |
320 |
309 |
1,275 |
1,343 |
||||||||
|
Total |
12,650 |
9,714 |
43,450 |
36,422 |
||||||||
|
Income of Consolidated Group before Income Taxes |
2,886 |
1,613 |
9,127 |
7,602 |
||||||||
|
Provision for income taxes |
643 |
330 |
2,007 |
1,658 |
||||||||
|
Income of Consolidated Group |
2,243 |
1,283 |
7,120 |
5,944 |
||||||||
|
Equity in income of unconsolidated affiliates |
1 |
1 |
10 |
21 |
||||||||
|
Net Income |
2,244 |
1,284 |
7,130 |
5,965 |
||||||||
|
Less: Net income (loss) attributable to noncontrolling interests |
(2) |
1 |
(1) |
2 |
||||||||
|
Net Income Attributable to Deere & Company |
$ |
2,246 |
$ |
1,283 |
$ |
7,131 |
$ |
5,963 |
||||
|
Per Share Data |
||||||||||||
|
Basic |
$ |
7.48 |
$ |
4.15 |
$ |
23.42 |
$ |
19.14 |
||||
|
Diluted |
$ |
7.44 |
$ |
4.12 |
$ |
23.28 |
$ |
18.99 |
||||
|
Dividends declared |
$ |
1.13 |
$ |
1.05 |
$ |
4.36 |
$ |
3.61 |
||||
|
Dividends paid |
$ |
1.13 |
$ |
.90 |
$ |
4.28 |
$ |
3.32 |
||||
|
Average Shares Outstanding |
||||||||||||
|
Basic |
300.4 |
309.1 |
304.5 |
311.6 |
||||||||
|
Diluted |
302.1 |
311.5 |
306.3 |
314.0 |
||||||||
|
See Condensed Notes to Consolidated Financial Statements. |
|
DEERE & COMPANY |
||||||
|
2022 |
2021 |
|||||
|
Assets |
||||||
|
Cash and cash equivalents |
$ |
4,774 |
$ |
8,017 |
||
|
Marketable securities |
734 |
728 |
||||
|
Trade accounts and notes receivable – net |
6,410 |
4,208 |
||||
|
Financing receivables – net |
36,634 |
33,799 |
||||
|
Financing receivables securitized – net |
5,936 |
4,659 |
||||
|
Other receivables |
2,492 |
1,765 |
||||
|
Equipment on operating leases – net |
6,623 |
6,988 |
||||
|
Inventories |
8,495 |
6,781 |
||||
|
Property and equipment – net |
6,056 |
5,820 |
||||
|
Goodwill |
3,687 |
3,291 |
||||
|
Other intangible assets – net |
1,218 |
1,275 |
||||
|
Retirement benefits |
3,730 |
3,601 |
||||
|
Deferred income taxes |
824 |
1,037 |
||||
|
Other assets |
2,417 |
2,145 |
||||
|
Total Assets |
$ |
90,030 |
$ |
84,114 |
||
|
Liabilities and Stockholders’ Equity |
||||||
|
Liabilities |
||||||
|
Short-term borrowings |
$ |
12,592 |
$ |
10,919 |
||
|
Short-term securitization borrowings |
5,711 |
4,605 |
||||
|
Accounts payable and accrued expenses |
14,822 |
12,348 |
||||
|
Deferred income taxes |
495 |
576 |
||||
|
Long-term borrowings |
33,596 |
32,888 |
||||
|
Retirement benefits and other liabilities |
2,457 |
4,344 |
||||
|
Total liabilities |
69,673 |
65,680 |
||||
|
Redeemable noncontrolling interest |
92 |
|||||
|
Stockholders’ Equity |
||||||
|
Total Deere & Company stockholders’ equity |
20,262 |
18,431 |
||||
|
Noncontrolling interests |
3 |
3 |
||||
|
Total stockholders’ equity |
20,265 |
18,434 |
||||
|
Total Liabilities and Stockholders’ Equity |
$ |
90,030 |
$ |
84,114 |
||
|
See Condensed Notes to Consolidated Financial Statements. |
|
DEERE & COMPANY |
||||||
|
2022 |
2021 |
|||||
|
Cash Flows from Operating Activities |
||||||
|
Net income |
$ |
7,130 |
$ |
5,965 |
||
|
Adjustments to reconcile net income to net cash provided by operating activities: |
||||||
|
Provision (credit) for credit losses |
192 |
(6) |
||||
|
Provision for depreciation and amortization |
1,895 |
2,050 |
||||
|
Impairment charges |
88 |
50 |
||||
|
Share-based compensation expense |
85 |
82 |
||||
|
Gain on remeasurement of previously held equity investment |
(326) |
|||||
|
Credit for deferred income taxes |
(66) |
(441) |
||||
|
Changes in assets and liabilities: |
||||||
|
Trade, notes, and financing receivables related to sales |
(2,483) |
969 |
||||
|
Inventories |
(2,091) |
(2,497) |
||||
|
Accounts payable and accrued expenses |
1,133 |
1,884 |
||||
|
Accrued income taxes payable/receivable |
141 |
11 |
||||
|
Retirement benefits |
(1,015) |
29 |
||||
|
Other |
16 |
(370) |
||||
|
Net cash provided by operating activities |
4,699 |
7,726 |
||||
|
Cash Flows from Investing Activities |
||||||
|
Collections of receivables (excluding receivables related to sales) |
20,907 |
18,959 |
||||
|
Proceeds from sales of equipment on operating leases |
2,093 |
2,094 |
||||
|
Cost of receivables acquired (excluding receivables related to sales) |
(26,300) |
(23,653) |
||||
|
Acquisitions of businesses, net of cash acquired |
(498) |
(244) |
||||
|
Purchases of property and equipment |
(1,134) |
(848) |
||||
|
Cost of equipment on operating leases acquired |
(2,654) |
(1,732) |
||||
|
Collateral on derivatives – net |
(642) |
(281) |
||||
|
Other |
(257) |
(45) |
||||
|
Net cash used for investing activities |
(8,485) |
(5,750) |
||||
|
Cash Flows from Financing Activities |
||||||
|
Increase in total short-term borrowings |
3,852 |
818 |
||||
|
Proceeds from long-term borrowings |
10,358 |
8,722 |
||||
|
Payments of long-term borrowings |
(8,445) |
(7,090) |
||||
|
Proceeds from issuance of common stock |
63 |
148 |
||||
|
Repurchases of common stock |
(3,597) |
(2,538) |
||||
|
Dividends paid |
(1,313) |
(1,040) |
||||
|
Other |
(92) |
(98) |
||||
|
Net cash provided by (used for) financing activities |
826 |
(1,078) |
||||
|
Effect of Exchange Rate Changes on Cash, Cash Equivalents, and |
(224) |
55 |
||||
|
Net Increase (Decrease) in Cash, Cash Equivalents, and Restricted Cash |
(3,184) |
953 |
||||
|
Cash, Cash Equivalents, and Restricted Cash at Beginning of Year |
8,125 |
7,172 |
||||
|
Cash, Cash Equivalents, and Restricted Cash at End of Year |
$ |
4,941 |
$ |
8,125 |
||
|
See Condensed Notes to Consolidated Financial Statements. |
|
DEERE & COMPANY |
|
|
(1) |
Acquisitions |
|
In the second quarter of 2022, the company acquired full ownership of three Deere-Hitachi joint venture factories and began new license and supply agreements with Hitachi Construction Machinery. The two companies also ended their joint venture manufacturing and marketing agreements. The total invested capital was $690 million, which consists of net cash consideration and the fair value of the previously held equity investment in the joint venture. The fair value of the previous equity investment created a non-cash gain of $326 million (pretax and after-tax), which was recorded in Other income and included in the construction and forestry segment’s operating profit. The invested capital was primarily allocated to Goodwill, Inventories, and Property and equipment. |
|
|
Special Items |
|
|
Three Months Ended Oct. 30, 2022 |
Year Ended Oct. 30, 2022 |
||||||||||||||||||||||||||||||
|
Expense (benefit): |
PPA |
SAT |
CF |
FS |
Total |
PPA |
SAT |
CF |
FS |
Total |
|||||||||||||||||||||
|
Inventory reserve – Cost of sales |
$ |
7 |
$ |
7 |
$ |
14 |
$ |
2 |
$ |
3 |
$ |
19 |
|||||||||||||||||||
|
Fixed asset impairment – |
30 |
11 |
41 |
||||||||||||||||||||||||||||
|
Intangible asset impairment – |
28 |
28 |
|||||||||||||||||||||||||||||
|
Allowance for credit losses – |
$ |
121 |
121 |
$ |
153 |
153 |
|||||||||||||||||||||||||
|
Voluntary-separation program – |
2 |
2 |
3 |
3 |
|||||||||||||||||||||||||||
|
Voluntary-separation program – |
1 |
$ |
2 |
3 |
4 |
6 |
1 |
11 |
|||||||||||||||||||||||
|
Contingent liabilities – Other |
(3) |
(2) |
(5) |
||||||||||||||||||||||||||||
|
Intercompany agreement |
63 |
$ |
8 |
50 |
(121) |
82 |
9 |
62 |
(153) |
||||||||||||||||||||||
|
Total Russia/Ukraine events |
$ |
70 |
$ |
8 |
$ |
50 |
128 |
$ |
133 |
$ |
11 |
$ |
110 |
$ |
1 |
255 |
|||||||||||||||
|
Net tax impact |
(32) |
(40) |
|||||||||||||||||||||||||||||
|
Total Russia/Ukraine events |
$ |
96 |
$ |
215 |
|||||||||||||||||||||||||||
In the first quarter of 2022, the company had a one-time payment related to the ratification of the UAW collective bargaining agreement, totaling $90 million.
In the third quarter of 2021, the company sold a closed factory that previously produced small agriculture equipment in China, resulting in a $27 million pretax gain. During the first quarter of 2021, the fixed assets in an asphalt plant factory in Germany were impaired by $38 million, pretax and after-tax. The company also continued to assess its manufacturing locations, resulting in additional long-lived asset impairments of $12 million pretax. The impairments were the result of a decline in forecasted financial performance that indicated it was probable future cash flows would not cover the carrying amount of the net assets. These impairments were offset by a favorable indirect tax ruling in Brazil of $58 million pretax. There were no special items in the fourth quarter of 2021.
The following table summarizes the operating profit impact, in millions of dollars, of the special items recorded for the three months and fiscal years ended October 30, 2022 and October 31, 2021:
|
Three Months |
Fiscal Years |
||||||||||||||||||||||||||||||
|
PPA |
SAT |
CF |
FS |
Total |
PPA |
SAT |
CF |
FS |
Total |
||||||||||||||||||||||
|
2022 Expense (benefit): |
|||||||||||||||||||||||||||||||
|
Gain on remeasurement of equity |
$ |
(326) |
$ |
(326) |
|||||||||||||||||||||||||||
|
Total Russia/Ukraine events |
$ |
70 |
$ |
8 |
$ |
50 |
$ |
128 |
$ |
133 |
$ |
11 |
110 |
$ |
1 |
255 |
|||||||||||||||
|
UAW ratification bonus – |
53 |
9 |
28 |
90 |
|||||||||||||||||||||||||||
|
Total expense (benefit) |
70 |
8 |
50 |
128 |
186 |
20 |
(188) |
1 |
19 |
||||||||||||||||||||||
|
2021 Expense (benefit): |
|||||||||||||||||||||||||||||||
|
Gain on sale – Other income |
(27) |
(27) |
|||||||||||||||||||||||||||||
|
Long-lived asset impairments – |
5 |
3 |
42 |
50 |
|||||||||||||||||||||||||||
|
Brazil indirect tax – Cost of sales |
(53) |
(5) |
(58) |
||||||||||||||||||||||||||||
|
Total expense (benefit) |
(48) |
(24) |
37 |
(35) |
|||||||||||||||||||||||||||
|
Period over period change |
$ |
70 |
$ |
8 |
$ |
50 |
$ |
128 |
$ |
234 |
$ |
44 |
$ |
(225) |
$ |
1 |
$ |
54 |
|||||||||||||
|
(2) |
Prior to fiscal year 2021, the operating results of the Wirtgen Group (Wirtgen) were incorporated into the company’s consolidated financial statements using a one-month lag period. The reporting lag was eliminated resulting in one additional month of Wirtgen activity in the first quarter and fiscal year of 2021. The effect was an increase to Net sales of $270 million, which the company considers immaterial to construction and forestry’s annual net sales. |
|
(3) |
The calculation of basic net income per share is based on the average number of shares outstanding. The calculation of diluted net income per share recognizes any dilutive effect of share-based compensation. |
|
(4) |
The consolidated financial statements represent the consolidation of all Deere & Company’s subsidiaries. The supplemental consolidating data is presented for informational purposes. Transactions between the Equipment Operations and Financial Services have been eliminated to arrive at the consolidated financial statements. In the supplemental consolidating data in Note 5 to the financial statements, the “Equipment Operations” represents the enterprise without “Financial Services”, which include the company’s production and precision agriculture operations, small agriculture and turf operations, and construction and forestry operations, and other corporate assets, liabilities, revenues, and expenses not reflected within “Financial Services.” |
|
DEERE & COMPANY |
|||||||||||||||||||||||||||
|
EQUIPMENT |
FINANCIAL |
||||||||||||||||||||||||||
|
OPERATIONS |
SERVICES |
ELIMINATIONS |
CONSOLIDATED |
||||||||||||||||||||||||
|
2022 |
2021 |
2022 |
2021 |
2022 |
2021 |
2022 |
2021 |
||||||||||||||||||||
|
Net Sales and Revenues |
|||||||||||||||||||||||||||
|
Net sales |
$ |
14,351 |
$ |
10,276 |
$ |
14,351 |
$ |
10,276 |
|||||||||||||||||||
|
Finance and interest income |
83 |
39 |
$ |
1,003 |
$ |
859 |
$ |
(161) |
$ |
(70) |
925 |
828 |
1 |
||||||||||||||
|
Other income |
233 |
229 |
231 |
84 |
(204) |
(90) |
260 |
223 |
2, 3 |
||||||||||||||||||
|
Total |
14,667 |
10,544 |
1,234 |
943 |
(365) |
(160) |
15,536 |
11,327 |
|||||||||||||||||||
|
Costs and Expenses |
|||||||||||||||||||||||||||
|
Cost of sales |
10,215 |
7,811 |
(1) |
(2) |
10,214 |
7,809 |
4 |
||||||||||||||||||||
|
Research and development expenses |
576 |
450 |
576 |
450 |
|||||||||||||||||||||||
|
Selling, administrative and general expenses |
922 |
798 |
272 |
140 |
(2) |
(2) |
1,192 |
936 |
4 |
||||||||||||||||||
|
Interest expense |
93 |
81 |
306 |
148 |
(51) |
(19) |
348 |
210 |
5 |
||||||||||||||||||
|
Interest compensation to Financial Services |
110 |
51 |
(110) |
(51) |
5 |
||||||||||||||||||||||
|
Other operating expenses |
163 |
40 |
358 |
355 |
(201) |
(86) |
320 |
309 |
6, 7 |
||||||||||||||||||
|
Total |
12,079 |
9,231 |
936 |
643 |
(365) |
(160) |
12,650 |
9,714 |
|||||||||||||||||||
|
Income before Income Taxes |
2,588 |
1,313 |
298 |
300 |
2,886 |
1,613 |
|||||||||||||||||||||
|
Provision for income taxes |
576 |
256 |
67 |
74 |
643 |
330 |
|||||||||||||||||||||
|
Income after Income Taxes |
2,012 |
1,057 |
231 |
226 |
2,243 |
1,283 |
|||||||||||||||||||||
|
Equity in income of unconsolidated affiliates |
1 |
1 |
1 |
1 |
|||||||||||||||||||||||
|
Net Income |
2,012 |
1,057 |
232 |
227 |
2,244 |
1,284 |
|||||||||||||||||||||
|
Less: Net income (loss) attributable to |
(2) |
1 |
(2) |
1 |
|||||||||||||||||||||||
|
Net Income Attributable to Deere & Company |
$ |
2,014 |
$ |
1,056 |
$ |
232 |
$ |
227 |
$ |
2,246 |
$ |
1,283 |
|||||||||||||||
|
1 Elimination of Financial Services’ interest income earned from Equipment Operations. |
|
2 Elimination of Equipment Operations’ margin from inventory transferred to equipment on operating leases. |
|
3 Elimination of Financial Services’ income related to intercompany guarantees of investments in certain international markets. |
|
4 Elimination of intercompany service fees. |
|
5 Elimination of Equipment Operations’ interest expense to Financial Services. |
|
6 Elimination of Financial Services’ lease depreciation expense related to inventory transferred to equipment on operating leases. |
|
7 Elimination of Equipment Operations’ expense related to intercompany guarantees of investments in certain international markets. |
|
DEERE & COMPANY |
|||||||||||||||||||||||||||
|
EQUIPMENT |
FINANCIAL |
||||||||||||||||||||||||||
|
OPERATIONS |
SERVICES |
ELIMINATIONS |
CONSOLIDATED |
||||||||||||||||||||||||
|
2022 |
2021 |
2022 |
2021 |
2022 |
2021 |
2022 |
2021 |
||||||||||||||||||||
|
Net Sales and Revenues |
|||||||||||||||||||||||||||
|
Net sales |
$ |
47,917 |
$ |
39,737 |
$ |
47,917 |
$ |
39,737 |
|||||||||||||||||||
|
Finance and interest income |
213 |
133 |
$ |
3,583 |
$ |
3,442 |
$ |
(431) |
$ |
(279) |
3,365 |
3,296 |
1 |
||||||||||||||
|
Other income |
1,261 |
941 |
502 |
352 |
(468) |
(302) |
1,295 |
991 |
2, 3 |
||||||||||||||||||
|
Total |
49,391 |
40,811 |
4,085 |
3,794 |
(899) |
(581) |
52,577 |
44,024 |
|||||||||||||||||||
|
Costs and Expenses |
|||||||||||||||||||||||||||
|
Cost of sales |
35,341 |
29,119 |
(3) |
(3) |
35,338 |
29,116 |
4 |
||||||||||||||||||||
|
Research and development expenses |
1,912 |
1,587 |
1,912 |
1,587 |
|||||||||||||||||||||||
|
Selling, administrative and general expenses |
3,137 |
2,887 |
735 |
504 |
(9) |
(8) |
3,863 |
3,383 |
4 |
||||||||||||||||||
|
Interest expense |
390 |
368 |
799 |
687 |
(127) |
(62) |
1,062 |
993 |
5 |
||||||||||||||||||
|
Interest compensation to Financial Services |
299 |
217 |
(299) |
(217) |
5 |
||||||||||||||||||||||
|
Other operating expenses |
350 |
181 |
1,386 |
1,453 |
(461) |
(291) |
1,275 |
1,343 |
6, 7 |
||||||||||||||||||
|
Total |
41,429 |
34,359 |
2,920 |
2,644 |
(899) |
(581) |
43,450 |
36,422 |
|||||||||||||||||||
|
Income before Income Taxes |
7,962 |
6,452 |
1,165 |
1,150 |
9,127 |
7,602 |
|||||||||||||||||||||
|
Provision for income taxes |
1,718 |
1,386 |
289 |
272 |
2,007 |
1,658 |
|||||||||||||||||||||
|
Income after Income Taxes |
6,244 |
5,066 |
876 |
878 |
7,120 |
5,944 |
|||||||||||||||||||||
|
Equity in income of unconsolidated affiliates |
6 |
18 |
4 |
3 |
10 |
21 |
|||||||||||||||||||||
|
Net Income |
6,250 |
5,084 |
880 |
881 |
7,130 |
5,965 |
|||||||||||||||||||||
|
Less: Net income (loss) attributable to |
(1) |
2 |
(1) |
2 |
|||||||||||||||||||||||
|
Net Income Attributable to Deere & Company |
$ |
6,251 |
$ |
5,082 |
$ |
880 |
$ |
881 |
$ |
7,131 |
$ |
5,963 |
|||||||||||||||
|
1 Elimination of Financial Services’ interest income earned from Equipment Operations. |
|
2 Elimination of Equipment Operations’ margin from inventory transferred to equipment on operating leases. |
|
3 Elimination of Financial Services’ income related to intercompany guarantees of investments in certain international markets. |
|
4 Elimination of intercompany service fees. |
|
5 Elimination of Equipment Operations’ interest expense to Financial Services. |
|
6 Elimination of Financial Services’ lease depreciation expense related to inventory transferred to equipment on operating leases. |
|
7 Elimination of Equipment Operations’ expense related to intercompany guarantees of investments in certain international markets. |
|
DEERE & COMPANY |
||||||||||||||||||||||||||
|
EQUIPMENT |
FINANCIAL |
|||||||||||||||||||||||||
|
OPERATIONS |
SERVICES |
ELIMINATIONS |
CONSOLIDATED |
|||||||||||||||||||||||
|
2022 |
2021 |
2022 |
2021 |
2022 |
2021 |
2022 |
2021 |
|||||||||||||||||||
|
Assets |
||||||||||||||||||||||||||
|
Cash and cash equivalents |
$ |
3,767 |
$ |
7,188 |
$ |
1,007 |
$ |
829 |
$ |
4,774 |
$ |
8,017 |
||||||||||||||
|
Marketable securities |
61 |
3 |
673 |
725 |
734 |
728 |
||||||||||||||||||||
|
Receivables from Financial Services |
6,569 |
5,564 |
$ |
(6,569) |
$ |
(5,564) |
8 |
|||||||||||||||||||
|
Trade accounts and notes |
1,273 |
1,155 |
6,434 |
3,895 |
(1,297) |
(842) |
6,410 |
4,208 |
9 |
|||||||||||||||||
|
Financing receivables – net |
47 |
73 |
36,587 |
33,726 |
36,634 |
33,799 |
||||||||||||||||||||
|
Financing receivables securitized – net |
10 |
5,936 |
4,649 |
5,936 |
4,659 |
|||||||||||||||||||||
|
Other receivables |
1,670 |
1,629 |
832 |
159 |
(10) |
(23) |
2,492 |
1,765 |
9 |
|||||||||||||||||
|
Equipment on operating leases – net |
6,623 |
6,988 |
6,623 |
6,988 |
||||||||||||||||||||||
|
Inventories |
8,495 |
6,781 |
8,495 |
6,781 |
||||||||||||||||||||||
|
Property and equipment – net |
6,021 |
5,783 |
35 |
37 |
6,056 |
5,820 |
||||||||||||||||||||
|
Goodwill |
3,687 |
3,291 |
3,687 |
3,291 |
||||||||||||||||||||||
|
Other intangible assets – net |
1,218 |
1,275 |
1,218 |
1,275 |
||||||||||||||||||||||
|
Retirement benefits |
3,666 |
3,539 |
66 |
64 |
(2) |
(2) |
3,730 |
3,601 |
10 |
|||||||||||||||||
|
Deferred income taxes |
940 |
1,215 |
45 |
53 |
(161) |
(231) |
824 |
1,037 |
11 |
|||||||||||||||||
|
Other assets |
1,794 |
1,646 |
626 |
499 |
(3) |
2,417 |
2,145 |
|||||||||||||||||||
|
Total Assets |
$ |
39,208 |
$ |
39,152 |
$ |
58,864 |
$ |
51,624 |
$ |
(8,042) |
$ |
(6,662) |
$ |
90,030 |
$ |
84,114 |
||||||||||
|
Liabilities and Stockholders’ Equity |
||||||||||||||||||||||||||
|
Liabilities |
||||||||||||||||||||||||||
|
Short-term borrowings |
$ |
1,040 |
$ |
1,509 |
$ |
11,552 |
$ |
9,410 |
$ |
12,592 |
$ |
10,919 |
||||||||||||||
|
Short-term securitization borrowings |
10 |
5,711 |
4,595 |
5,711 |
4,605 |
|||||||||||||||||||||
|
Payables to Equipment Operations |
6,569 |
5,564 |
$ |
(6,569) |
$ |
(5,564) |
8 |
|||||||||||||||||||
|
Accounts payable and |
12,962 |
11,198 |
3,170 |
2,015 |
(1,310) |
(865) |
14,822 |
12,348 |
9 |
|||||||||||||||||
|
Deferred income taxes |
380 |
438 |
276 |
369 |
(161) |
(231) |
495 |
576 |
11 |
|||||||||||||||||
|
Long-term borrowings |
7,917 |
8,915 |
25,679 |
23,973 |
33,596 |
32,888 |
||||||||||||||||||||
|
Retirement benefits and |
2,351 |
4,239 |
108 |
107 |
(2) |
(2) |
2,457 |
4,344 |
10 |
|||||||||||||||||
|
Total liabilities |
24,650 |
26,309 |
53,065 |
46,033 |
(8,042) |
(6,662) |
69,673 |
65,680 |
||||||||||||||||||
|
Redeemable noncontrolling interest |
92 |
92 |
||||||||||||||||||||||||
|
Stockholders’ Equity |
||||||||||||||||||||||||||
|
Total Deere & Company |
20,262 |
18,431 |
5,799 |
5,591 |
(5,799) |
(5,591) |
20,262 |
18,431 |
12 |
|||||||||||||||||
|
Noncontrolling interests |
3 |
3 |
3 |
3 |
||||||||||||||||||||||
|
Financial Services equity |
(5,799) |
(5,591) |
5,799 |
5,591 |
12 |
|||||||||||||||||||||
|
Adjusted total stockholders’ equity |
14,466 |
12,843 |
5,799 |
5,591 |
20,265 |
18,434 |
||||||||||||||||||||
|
Total Liabilities and |
$ |
39,208 |
$ |
39,152 |
$ |
58,864 |
$ |
51,624 |
$ |
(8,042) |
$ |
(6,662) |
$ |
90,030 |
$ |
84,114 |
||||||||||
|
8 Elimination of receivables / payables between Equipment Operations and Financial Services. |
|
9 Primarily reclassification of sales incentive accruals on receivables sold to Financial Services. |
|
10 Reclassification of net pension assets / liabilities. |
|
11 Reclassification of deferred tax assets / liabilities in the same taxing jurisdictions. |
|
12 Elimination of Financial Services equity. |
|
DEERE & COMPANY |
|||||||||||||||||||||||||||
|
EQUIPMENT |
FINANCIAL |
||||||||||||||||||||||||||
|
OPERATIONS |
SERVICES |
ELIMINATIONS |
CONSOLIDATED |
||||||||||||||||||||||||
|
2022 |
2021 |
2022 |
2021 |
2022 |
2021 |
2022 |
2021 |
||||||||||||||||||||
|
Cash Flows from Operating Activities |
|||||||||||||||||||||||||||
|
Net income |
$ |
6,250 |
$ |
5,084 |
$ |
880 |
$ |
881 |
$ |
7,130 |
$ |
5,965 |
|||||||||||||||
|
Adjustments to reconcile net income to net cash provided |
|||||||||||||||||||||||||||
|
Provision (credit) for credit losses |
3 |
7 |
189 |
(13) |
192 |
(6) |
|||||||||||||||||||||
|
Provision for depreciation and amortization |
1,041 |
1,043 |
1,050 |
1,140 |
$ |
(196) |
$ |
(133) |
1,895 |
2,050 |
13 |
||||||||||||||||
|
Impairment charges |
88 |
50 |
88 |
50 |
|||||||||||||||||||||||
|
Share-based compensation expense |
85 |
82 |
85 |
82 |
14 |
||||||||||||||||||||||
|
Gain on remeasurement of previously held equity investment |
(326) |
(326) |
|||||||||||||||||||||||||
|
Undistributed earnings of Financial Services |
444 |
555 |
(444) |
(555) |
15 |
||||||||||||||||||||||
|
Provision (credit) for deferred income taxes |
8 |
(369) |
(74) |
(72) |
(66) |
(441) |
|||||||||||||||||||||
|
Changes in assets and liabilities: |
|||||||||||||||||||||||||||
|
Trade, notes, and financing receivables related to sales |
(189) |
(105) |
(2,294) |
1,074 |
(2,483) |
969 |
16, 18, 19 |
||||||||||||||||||||
|
Inventories |
(1,924) |
(1,835) |
(167) |
(662) |
(2,091) |
(2,497) |
17 |
||||||||||||||||||||
|
Accounts payable and accrued expenses |
1,444 |
1,589 |
143 |
57 |
(454) |
238 |
1,133 |
1,884 |
18 |
||||||||||||||||||
|
Accrued income taxes payable/receivable |
166 |
13 |
(25) |
(2) |
141 |
11 |
|||||||||||||||||||||
|
Retirement benefits |
(1,016) |
30 |
1 |
(1) |
(1,015) |
29 |
|||||||||||||||||||||
|
Other |
250 |
(162) |
(287) |
(25) |
53 |
(183) |
16 |
(370) |
13, 14, 17 |
||||||||||||||||||
|
Net cash provided by operating activities |
6,239 |
5,900 |
1,877 |
1,965 |
(3,417) |
(139) |
4,699 |
7,726 |
|||||||||||||||||||
|
Cash Flows from Investing Activities |
|||||||||||||||||||||||||||
|
Collections of receivables (excluding receivables related |
22,400 |
20,527 |
(1,493) |
(1,568) |
20,907 |
18,959 |
16 |
||||||||||||||||||||
|
Proceeds from sales of equipment on operating leases |
2,093 |
2,094 |
2,093 |
2,094 |
|||||||||||||||||||||||
|
Cost of receivables acquired (excluding receivables related |
(26,903) |
(25,305) |
603 |
1,652 |
(26,300) |
(23,653) |
16 |
||||||||||||||||||||
|
Acquisitions of businesses, net of cash acquired |
(498) |
(244) |
(498) |
(244) |
|||||||||||||||||||||||
|
Purchases of property and equipment |
(1,131) |
(845) |
(3) |
(3) |
(1,134) |
(848) |
|||||||||||||||||||||
|
Cost of equipment on operating leases acquired |
(2,879) |
(2,627) |
225 |
895 |
(2,654) |
(1,732) |
17 |
||||||||||||||||||||
|
Decrease (increase) in trade and wholesale receivables |
(3,601) |
1,364 |
3,601 |
(1,364) |
16 |
||||||||||||||||||||||
|
Collateral on derivatives – net |
5 |
(7) |
(647) |
(274) |
(642) |
(281) |
|||||||||||||||||||||
|
Other |
(206) |
62 |
(81) |
(84) |
30 |
(23) |
(257) |
(45) |
15, 19 |
||||||||||||||||||
|
Net cash used for investing activities |
(1,830) |
(1,034) |
(9,621) |
(4,308) |
2,966 |
(408) |
(8,485) |
(5,750) |
|||||||||||||||||||
|
Cash Flows from Financing Activities |
|||||||||||||||||||||||||||
|
Increase in total short-term borrowings |
136 |
65 |
3,716 |
753 |
3,852 |
818 |
|||||||||||||||||||||
|
Change in intercompany receivables/payables |
(1,633) |
(354) |
1,633 |
354 |
|||||||||||||||||||||||
|
Proceeds from long-term borrowings |
138 |
11 |
10,220 |
8,711 |
10,358 |
8,722 |
|||||||||||||||||||||
|
Payments of long-term borrowings |
(1,356) |
(94) |
(7,089) |
(6,996) |
(8,445) |
(7,090) |
|||||||||||||||||||||
|
Proceeds from issuance of common stock |
63 |
148 |
63 |
148 |
|||||||||||||||||||||||
|
Repurchases of common stock |
(3,597) |
(2,538) |
(3,597) |
(2,538) |
|||||||||||||||||||||||
|
Dividends paid |
(1,313) |
(1,040) |
(444) |
(555) |
444 |
555 |
(1,313) |
(1,040) |
15 |
||||||||||||||||||
|
Other |
(57) |
(61) |
(42) |
(29) |
7 |
(8) |
(92) |
(98) |
15 |
||||||||||||||||||
|
Net cash provided by (used for) financing activities |
(7,619) |
(3,863) |
7,994 |
2,238 |
451 |
547 |
826 |
(1,078) |
|||||||||||||||||||
|
Effect of Exchange Rate Changes on Cash, Cash |
(209) |
41 |
(15) |
14 |
(224) |
55 |
|||||||||||||||||||||
|
Net Increase (Decrease) in Cash, Cash Equivalents, and |
(3,419) |
1,044 |
235 |
(91) |
(3,184) |
953 |
|||||||||||||||||||||
|
Cash, Cash Equivalents, and Restricted Cash at |
7,200 |
6,156 |
925 |
1,016 |
8,125 |
7,172 |
|||||||||||||||||||||
|
Cash, Cash Equivalents, and Restricted Cash at |
$ |
3,781 |
$ |
7,200 |
$ |
1,160 |
$ |
925 |
$ |
4,941 |
$ |
8,125 |
|||||||||||||||
|
13 |
Elimination of depreciation on leases related to inventory transferred to equipment on operating leases. |
|
14 |
Reclassification of share-based compensation expense. |
|
15 |
Elimination of dividends from Financial Services to the Equipment Operations, which are included in the Equipment Operations operating activities, and capital investments in Financial Services from the Equipment Operations. |
|
16 |
Primarily reclassification of receivables related to the sale of equipment. |
|
17 |
Reclassification of direct lease agreements with retail customers. |
|
18 |
Reclassification of sales incentive accruals on receivables sold to Financial Services. |
|
19 |
Elimination and reclassification of the effects of Financial Services partial financing of the construction and forestry retail locations sales and subsequent collection of those amounts. |
DEERE & COMPANY
OTHER FINANCIAL INFORMATION
The company evaluates its business results on the basis of accounting principles generally accepted in the United States. In addition, it uses a metric referred to as Shareholder Value Added (SVA), which management believes is an appropriate measure for the performance of its businesses. SVA is, in effect, the pretax profit left over after subtracting the cost of enterprise capital. The company is aiming for a sustained creation of SVA and is using this metric for various performance goals. Certain compensation is also determined on the basis of performance using this measure. For purposes of determining SVA, each of the equipment segments is assessed a pretax cost of assets, which on an annual basis is approximately 12 percent of the segment’s average identifiable operating assets during the applicable period with inventory at standard cost. Management believes that valuing inventories at standard cost more closely approximates the current cost of inventory and the company’s investment in the asset. The Financial Services segment is assessed an annual pretax cost of approximately 13 percent of the segment’s average equity. The cost of assets or equity, as applicable, is deducted from the operating profit or added to the operating loss of each segment to determine the amount of SVA.
|
Equipment |
Production & |
Small Ag |
Construction |
|||||||||||||||||||||||
|
For the Years Ended |
Operations |
Precision Ag |
& Turf |
& Forestry |
||||||||||||||||||||||
|
Oct 30 |
Oct 31 |
Oct 30 |
Oct 31 |
Oct 30 |
Oct 31 |
Oct 30 |
Oct 31 |
|||||||||||||||||||
|
Dollars in millions |
2022 |
2021 |
2022 |
2021 |
2022 |
2021 |
2022 |
2021 |
||||||||||||||||||
|
Net Sales |
$ |
47,917 |
$ |
39,737 |
$ |
22,002 |
$ |
16,509 |
$ |
13,381 |
$ |
11,860 |
$ |
12,534 |
$ |
11,368 |
||||||||||
|
Average Identifiable Assets |
||||||||||||||||||||||||||
|
With Inventories at LIFO |
$ |
19,420 |
$ |
16,680 |
$ |
8,336 |
$ |
6,640 |
$ |
4,349 |
$ |
3,625 |
$ |
6,735 |
$ |
6,415 |
||||||||||
|
With Inventories at Standard Cost |
20,983 |
18,045 |
9,118 |
7,321 |
4,795 |
4,047 |
7,070 |
6,677 |
||||||||||||||||||
|
Operating Profit |
$ |
8,349 |
$ |
6,868 |
$ |
4,386 |
$ |
3,334 |
$ |
1,949 |
$ |
2,045 |
$ |
2,014 |
$ |
1,489 |
||||||||||
|
Percent of Net Sales |
17.4 |
% |
17.3 |
% |
19.9 |
% |
20.2 |
% |
14.6 |
% |
17.2 |
% |
16.1 |
% |
13.1 |
% |
||||||||||
|
Operating Return on Assets |
||||||||||||||||||||||||||
|
With Inventories at LIFO |
43.0 |
% |
41.2 |
% |
52.6 |
% |
50.2 |
% |
44.8 |
% |
56.4 |
% |
29.9 |
% |
23.2 |
% |
||||||||||
|
With Inventories at Standard Cost |
39.8 |
% |
38.1 |
% |
48.1 |
% |
45.5 |
% |
40.6 |
% |
50.5 |
% |
28.5 |
% |
22.3 |
% |
||||||||||
|
SVA Cost of Assets |
$ |
(2,519) |
$ |
(2,165) |
$ |
(1,094) |
$ |
(878) |
$ |
(576) |
$ |
(486) |
$ |
(849) |
$ |
(801) |
||||||||||
|
SVA |
5,830 |
4,703 |
3,292 |
2,456 |
1,373 |
1,559 |
1,165 |
688 |
||||||||||||||||||
|
Financial |
||||||||||||||||||||||||||
|
For the Years Ended |
Services |
|||||||||||||||||||||||||
|
Oct 30 |
Oct 31 |
|||||||||||||||||||||||||
|
Dollars in millions |
2022 |
2021 |
||||||||||||||||||||||||
|
Net Income Attributable to Deere & Company |
$ |
880 |
$ |
881 |
||||||||||||||||||||||
|
Average Equity |
5,725 |
5,497 |
||||||||||||||||||||||||
|
Return on Equity |
15.4 |
% |
16.0 |
% |
||||||||||||||||||||||
|
Operating Profit |
$ |
1,159 |
$ |
1,144 |
||||||||||||||||||||||
|
Cost of Equity |
(760) |
(719) |
||||||||||||||||||||||||
|
SVA |
399 |
425 |
||||||||||||||||||||||||
![]() View original content to download multimedia:https://www.prnewswire.com/news-releases/deere-reports-net-income-of-2-246-billion-for-fourth-quarter-7-131-billion-for-fiscal-year-301685893.html
View original content to download multimedia:https://www.prnewswire.com/news-releases/deere-reports-net-income-of-2-246-billion-for-fourth-quarter-7-131-billion-for-fiscal-year-301685893.html
SOURCE Deere & Company
