


Although enterprise software giant Oracle (ORCL) has unquestionably ranked among the tech sector’s best performers this year, it’s not immune to volatility. Uncharacteristically, over the past five sessions, ORCL stock has slipped more than 8%, primarily due to a skeptical outlook from analysts. Nevertheless, the subsequent unusual quantitative signal that ORCL has flashed makes it an intriguing contrarian target.
Elevate Your Investing Strategy:
- Take advantage of TipRanks Premium at 55% off! Unlock powerful investing tools, advanced data, and expert analyst insights to help you invest with confidence.
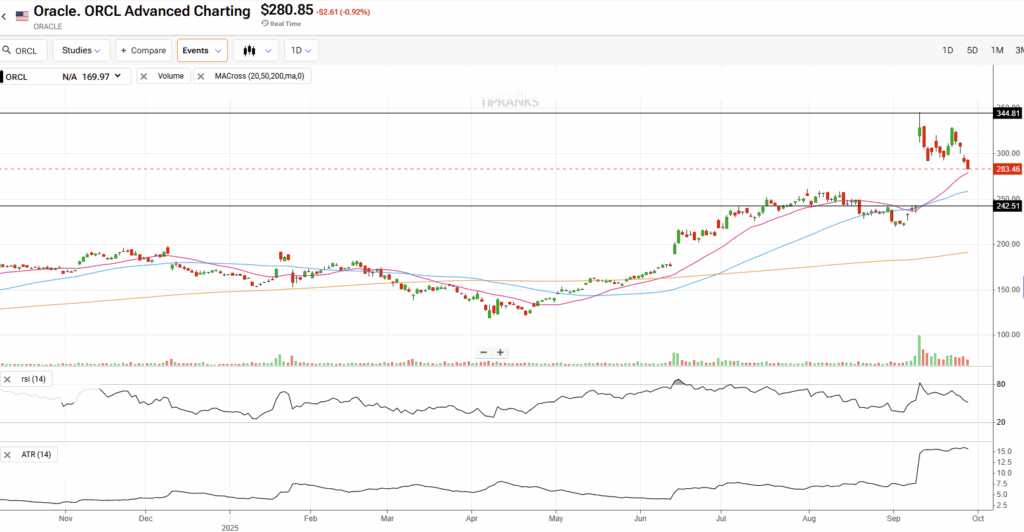
In the trailing half-year period, Oracle has been on an incredible run, experiencing a doubling of its market value. A significant chunk of this rally came recently following the company’s fiscal first-quarter earnings report. Although the tech giant posted earnings and sales data that missed analysts’ expectations, ORCL stock soared 22%, primarily due to broader implications related to artificial intelligence.
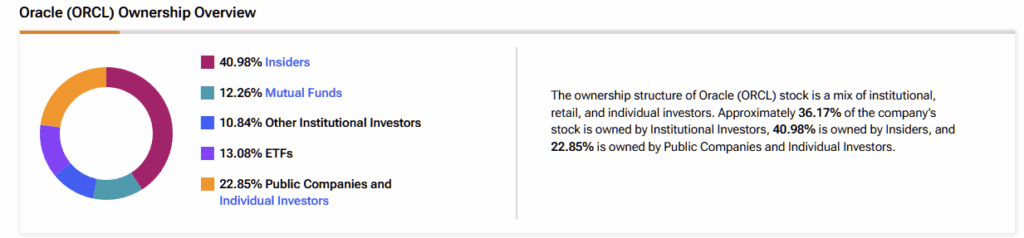
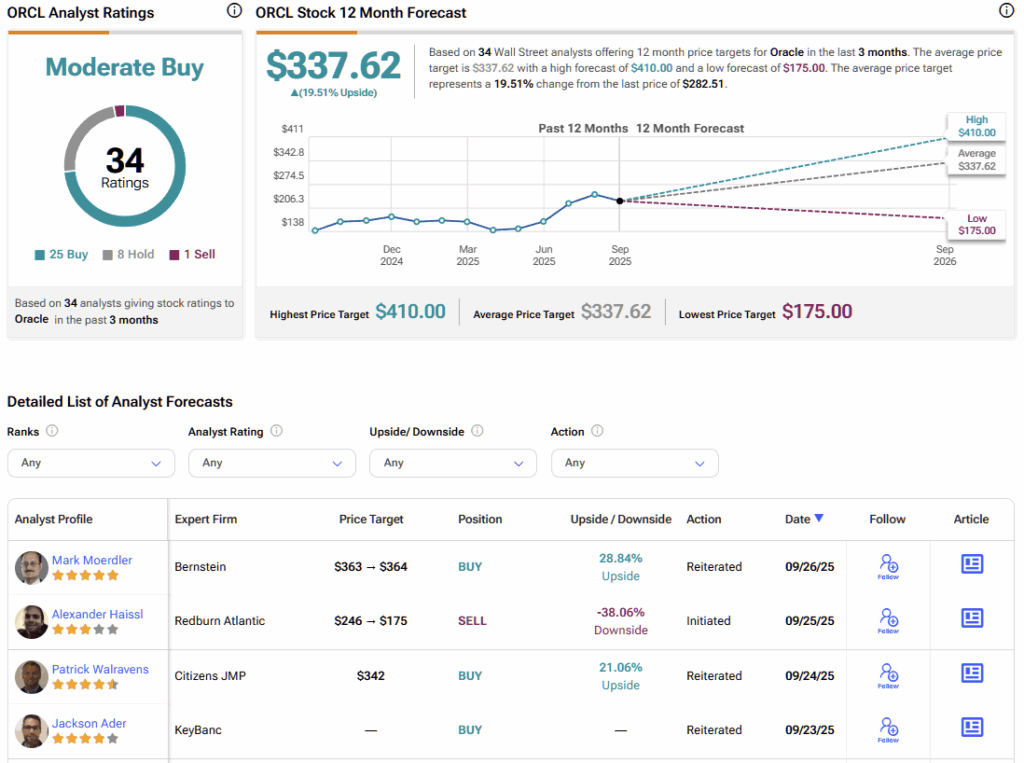
However, with so much total market capitalization concentrated in the hands of a few elite, some experts have sounded the alarm. In particular, Redburn Atlantic analyst Alexander Haissl initiated coverage of ORCL stock with a Sell rating. What’s more, the research firm set a price target of $175 on the stock, reflecting at the time a steep discount of about 40%.
While the news isn’t exactly encouraging, ORCL stock is now flashing a rare quantitative signal — one that could eventually hint at a recovery. Using a vertical options spread, it’s possible to extract a triple-digit-percentage payout from a relatively small move in the underlying equity. Given my specific trading strategy, I’m Bullish on ORCL.
The Reasoning Behind an Options Strategy for ORCL Stock
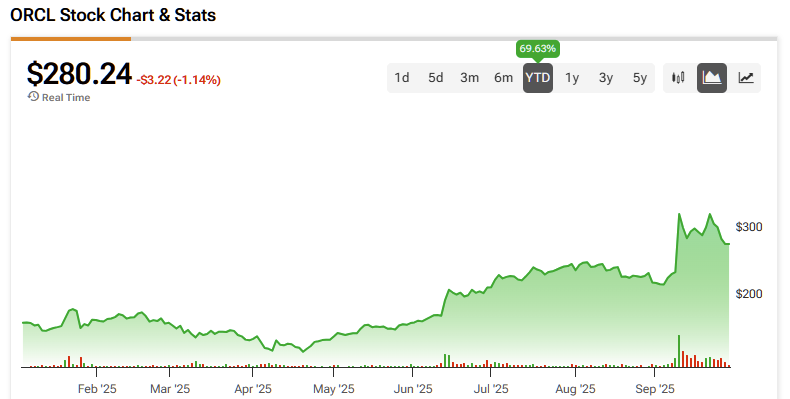
Since the start of this year, ORCL stock has gained almost 70%. Given its market cap of roughly $806 billion, it’s a reasonable bet that much, if not most, of the good news has already been baked into the stock. As such, the forward movements over the next several weeks are likely to be relatively small. Although volatility has risen sharply in recent weeks, the likelihood of it being sustained is low.
Given this forecast, a vertical options spread, such as the bull call spread, may be the most effective strategy to capitalize on ORCL. In the bull spread, we combine a debit-based trade with a credit-based one, with the idea that the proceeds from the credit side will help offset some of the premium tied to the debit side.
This structure results in a capped-risk, capped-reward trade. The bullish side is partially offset by the credit leg, effectively lowering the entry cost. Given the expectation of limited movement in ORCL shares, the cap on potential upside is a reasonable trade-off.
The Difference Between Model-Driven and Empirical Frameworks
Before buying a bull spread, we must first calculate the probability of where ORCL stock may end up at a particular point in time. Since options expire, the probabilistic calculation is a multi-dimensional one.
For most traders, a model-driven framework is applied, which involves integrating key datapoints, such as the current market price, implied volatility, and time to expiration, into a lognormal distribution (i.e., the Black-Scholes-Merton model). Subsequently, the probability of profit of a particular options trade is mathematically defined as a specific area under this distribution curve that extends beyond the breakeven price.
For the scientifically inclined, these stochastic models are mathematically elegant, but at the end of the day, they’re simulations. Basically, the probability is only as reasonable as the underlying presupposition.
Another approach — the one that I prefer — is empirical. Rather than calculating probabilities based on simulated prices, traders can extract forecasts from past analogs; that is, map out the future by studying what has occurred in the past.
However, I go one step further by theorizing that certain behavioral states produce different probabilities than what would usually be expected from the aggregate of all price activities. Specifically, I borrow heavily from the work of Russian mathematician Andrey Markov by forwarding the thesis that the last 10 weeks of price action can help elucidate how the next 10 weeks may materialize.
Getting Down to the Business of Options Trading
For Oracle, in the last 10 weeks, its equity printed a rare 4-6-U sequence: four up weeks (defined as the return between Monday’s open and Friday’s close), six down weeks, with an overall positive trajectory. It’s a counterintuitive signal since the number of distributive sessions outweighs accumulative, yet the security trends upward. Still, over the next several weeks, ORCL stock should rise higher — but there’s a caveat.
For the first six weeks following the flashing of the 4-6-U sequence (using a dataset that extends back to January 2019), the odds that ORCL will be positive relative to the anchor price (Friday’s close of $283.46) are pretty poor, especially compared to the aggregate probability of all outcomes. However, momentum starts to pick up in the later weeks.
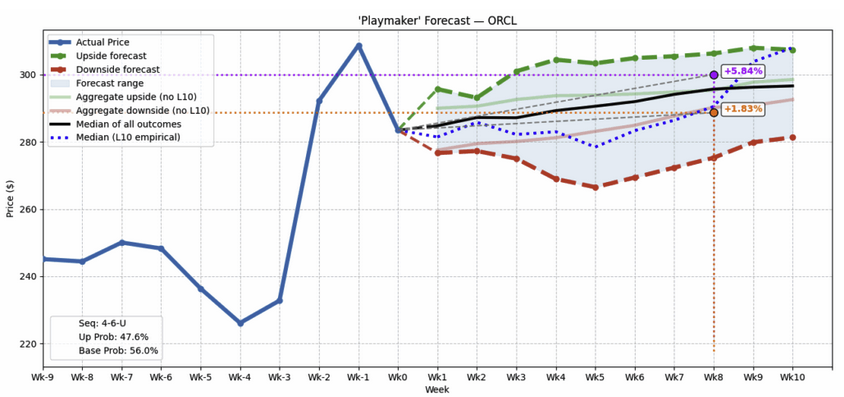
What’s really interesting is that the median price of outcomes tied to the 4-6-U sequence comes in around $289 at the end of Week 8, which coincides with the options chain expiring November 21st. For aggressive traders, this area is an ideal range to “place” a vertical spread’s breakeven price.

Given the above intel, the options trade that arguably makes the most sense is the 280/300 bull spread expiring November 21st. This transaction involves buying the $280 call and simultaneously selling the $300 call, for a net debit paid of $865 (the maximum possible loss on the trade).
Should ORCL stock rise through the second-leg strike price of $300 at expiration, the maximum profit is $1,135, a payout of over 131%. Breakeven comes in at $288.65.
Options calculators might rate the 280/300 spread as carrying a probability of profit of around 46%. However, based on an empirical approach, the probability is closer to 50%. That’s because the breakeven price is about the same as the median price of outcomes associated with the 4-6-U sequence on the projected date.
What is the 12-Month Forecast for ORCL Stock?
Turning to Wall Street, ORCL stock carries a Moderate Buy consensus rating based on 25 Buys, eight Holds, and one Sell rating. The average ORCL stock price target is $337.62, implying almost 20% upside potential over the next 52 weeks.
Oracle’s Volatility Triggers Rare Quant Signal for Options Traders
Although Oracle has been a standout tech player, it has recently encountered volatility, due in part to rising skepticism. Still, the red ink has caused ORCL stock to flash a rare quant signal. Using an empirical approach that respects actual price geometry, traders can calculate expected probabilities and guide themselves to a potentially winning options strategy.