For even the most seasoned investors, choosing the right stocks to buy during earnings season, and beating the market, are highly challenging. To make handsome returns during an earnings season, investors search for the most appropriate strategies to select the right stocks and make the bets at the right time. Well, look no further!
Pick the best stocks and maximize your portfolio:
- Discover top-rated stocks from highly ranked analysts with Analyst Top Stocks!
- Easily identify outperforming stocks and invest smarter with Top Smart Score Stocks
Read on to learn about three unique financial research tools you can use to help make the right investment choices in the earnings season.
Top Analyst Stocks
The team at TipRanks consolidates the recommendations of Wall Street analysts and assimilates the information in an easy-to-understand format. They also rank analysts based on the historical performance of their stock ratings and average returns earned per rating, making it easy to determine which analysts are the Top Analysts.
The Top Analyst Stocks page can be used as a valuable research tool to pick stocks that are currently most favored by analysts. Following the stock trades of successful analysts will help investors make an informed decision to buy or sell stocks, both ahead of earnings and after the earnings release. With the Top Analyst Stocks page, you can see all the stocks that have received a Strong Buy or a Strong Sell rating in the past week. The list is updated daily to reflect analysts’ latest views.
On the top of this page, you can see the Analyst Consensus by Sector, which is a graphical representation of the sectoral breakdown of buy and sell views. Plus, the page comprises a table that shows the Company Name, Price Change, Top Analysts’ Price Target, Stock Rating, Date of latest rating, and the Reason for the Rating.

Top Website Traffic Stocks
Website Traffic Trends is another tool you can use to pick the right stocks during earnings season. The Top Website Traffic Stocks tool allows you to gauge the number of unique and total visitors who visited a website during a month, quarter, or year-to-date period. Plus, this information can be compared to both the immediately preceding period and the same period in the prior year.
Importantly, this analysis can be used to predict a company’s quarterly performance and stock price trajectory, ahead of earnings. A decreasing trend means the company is losing website traffic, thus implying weak performance. On the contrary, an increasing trend implies that a higher number of customers are interested in the company’s products, which could lead to improved performance.
You can study a company’s website traffic ahead of its earnings results to gauge the popularity of its products in the to-be-reported quarter and make an educated guess about its performance well in advance. It’s easy for you to research companies by reviewing lists of of the Most Visited Websites, Top Trending Websites, and Websites Losing Traffic.

Risk Factor Analysis
It is imperative to understand the risks a company faces before investing in the stock. A publicly listed company usually lists all the “Risk Factors” in its quarterly and annual regulatory filing. If you have gone through one of these, you will know that it comprises a long list of technical words that can be difficult to understand.
TipRanks has consolidated and represented the data in the easiest form to help you understand it quickly and stay abreast of all the company’s latest risks. The Risk Factors tool uses machine learning and proprietary algorithms to validate the risk factors on any stock.
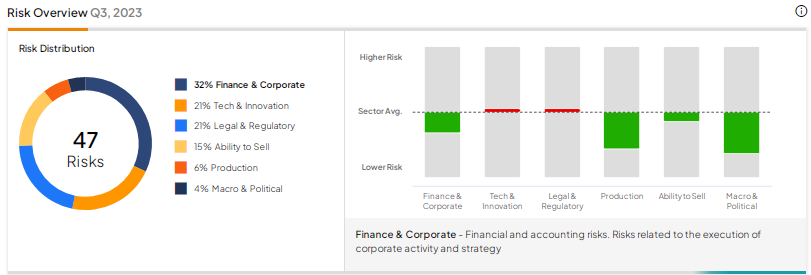
The risk factors are broken down into six major categories with a further relevant breakdown in each category. The main categories of risk include Finance & Corporate, Production, Legal & Regulatory, Macro & Political, Tech & Innovation, and Ability to Sell. The tool also shows whether a company has added, deleted, or altered a certain risk in its risk profile.
Studying these updated factors before every quarterly earnings release can help you identify if a company’s exposure to a particular risk factor is increasing or decreasing and, thus, help you decide your investment stance on the stock.
As an example, see Meta Platforms’ (NASDAQ:META) Risk Analysis graph below:

Concluding Thoughts
Earnings season can be one of the most challenging times to predict a stock’s performance. An earnings beat or miss by a company and/or its outlook can affect the stock prices of other companies from that sector.
Analyzing stocks using these market-beating research tools will help you navigate through earnings season. The Top Analyst Stocks, Website Traffic, and Risk Factor Analysis tools are invaluable tools for boosting your stock-picking prowess and portfolio returns.


