TipRanks brings you an advanced Chart tool that will enable you to conduct a thorough technical analysis of an Exchange-Traded Fund (ETF). The Chart Tool provides users with a visual representation of historical performance for a particular ETF. As with all our tools, our advanced chart is comprehensive and easy to use, and integrates unique TipRanks data.
How to Find the Advanced Chart Tool
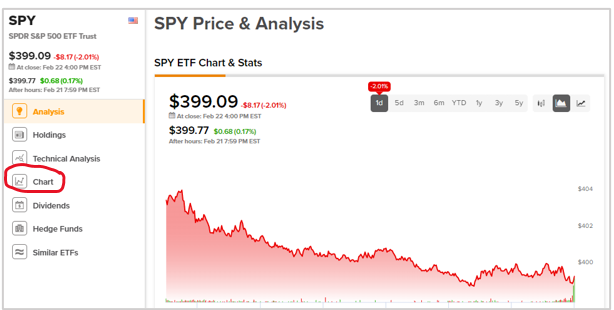
To start, search for the ETF you are researching using the search bar, by entering either the name of the fund or its ticker symbol. By default, when searching for an ETF, it will take you first to the ETF Analysis page. The Chart page appears on the menu on the left-hand side of the screen.

The chart offers different ways to present and analyze technical data. Above the chart, you will see options to filter data, adjust the layout, and switch between ETFs. Let’s understand each of the functions briefly with the example of a popular ETF, the SPDR S&P 500 ETF Trust (SPY).
Studies
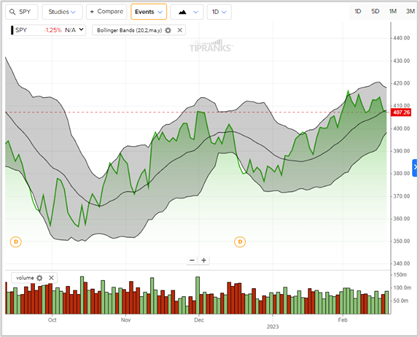
The chart provides a wealth of advanced analysis tools. You can add numerous studies and indicators, including accumulation/ distribution, moving averages, MACD, on-balance volume, relative strength index (RSI), Bollinger Bands, and more.
Compare
If you want to add other ETFs to the chart, this is easily done by entering the ticker names into the compare button.
Events
You can also add dividends and analyst ratings to the chart.
Below is a screenshot of the chart for SPY with different studies and events added from the available options.

Chart Type
There are 13 different chart types available, and six aggregated types to choose from.
Chart Interval
Adjust the chart intervals from 1 minute to 1 month.
Additional Settings
You can make further adjustments to the chart.
Timeframe
You can adjust the timeframe from a minimum of 1 day to a maximum of 5 years.
Drawing
Drawing mode offers you different ways to add elements to the chart. Clicking on the pencil icon opens the drawing tools, and the icon with three dots opens more options for drawing on the chart.
There are 30 drawing options, such as horizontal and vertical lines, trend lines, Elliot Waves, and more. Delete all your drawings by clicking on the trash icon, or right-click to edit and delete drawings.
Chart Settings
Use the chart settings to switch on the range selector and extended hours, change the log scale and the Y-axis, use additional features such as shortcuts and hotkeys, import data, and localize the chart according to the time zone.
At any time, you can easily reset the chart to the default mode by clicking on the circular arrow.
Choose ETFs to Analyze
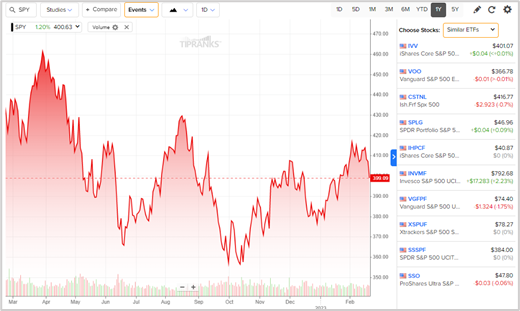
We’ve also made it easy for you to analyze the ETFs that are most important to you. Access all the ETFs in your watchlist and portfolio, as well as similar ETFs, and navigate effortlessly to their charts.

Now, give it a try and see how the Chart tool effectively guides you in studying ETFs.


