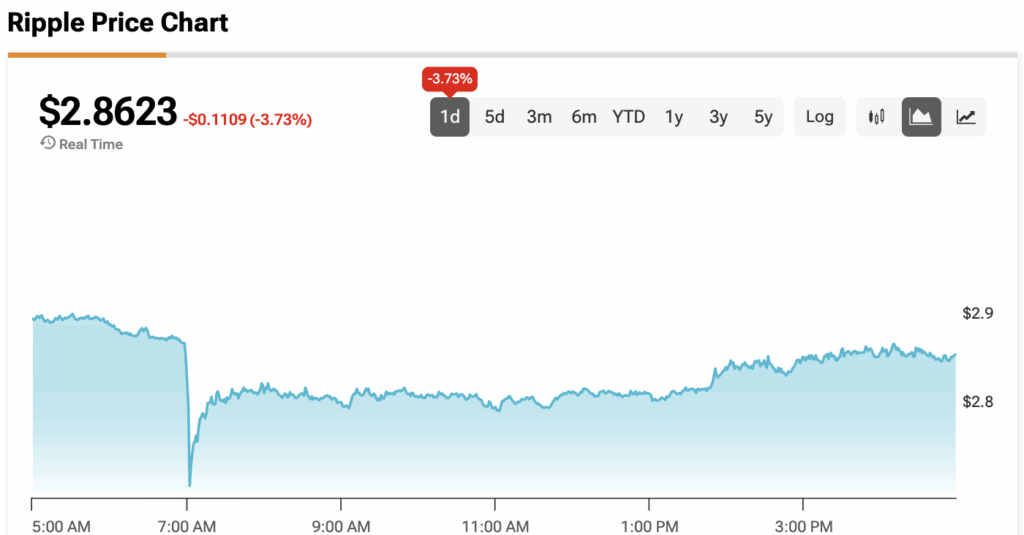
XRP (XRP-USD) slipped about 5% in the past 24 hours, trading around $2.80 on Monday. The failure to hold above $3 matters because it is not just another number on a chart It’s important to know that round numbers often serve as emotional checkpoints. Falling below them suggests the market’s momentum has shifted.
Elevate Your Investing Strategy:
- Take advantage of TipRanks Premium at 50% off! Unlock powerful investing tools, advanced data, and expert analyst insights to help you invest with confidence.
In XRP’s case, $3 had become a symbolic milestone after months of climbing, so losing that level is seen as a warning that the rally may be losing fuel.
XRP’s Chart Signals a Bearish Triangle
Technical analysts are watching XRP’s chart, and what they see is a classic descending triangle. This is a pattern where each rebound stalls at a lower high, showing that sellers are stepping in earlier each time.
At the same time, buyers are defending the same floor, creating a flat line of support. When that floor finally breaks, the result is often a sharp move downward.
For XRP, the key support is around $2.75. If price closes below that, chart watchers say a sell-off could carry it as low as $2.07. This price level would mark a drop of more than a quarter from where it stands now.
Profit-Taking Creates Extra Pressure
Beyond the chart, there is another factor weighing on XRP: profit-taking. One way analysts measure this is through a metric called Net Unrealized Profit/Loss, or NUPL.
In simple terms, it shows how many holders are in profit compared with those in loss.
Today, more than 94% of XRP’s supply is in profit. This sounds like a win, but in practice it creates pressure. When nearly everyone is sitting on gains, many decide it is time to cash out. XRP’s NUPL reading is now in the 0.5–0.6 zone, a level that has coincided with local tops in the past. This happened in 2017, again in 2021, and once more in January 2025, each time followed by sharp corrections. Traders fear history could be repeating.
Analysts Still See the Bigger Trend as Bullish
Despite the warning signs, not everyone is convinced XRP is heading for disaster.
Some analysts argue the current pullback is just noise in a larger uptrend. They point to the weekly and monthly charts, which still show bullish structures forming. CryptoBull, for instance, predicts XRP will climb to $5 as soon as October, brushing aside the latest dip as a technical correction.
Another popular commentator, Egrag Crypto, told his followers that while short-term charts look shaky, the higher time frames are “crystal clear.” He sees an ascending triangle forming on the monthly chart with a target as high as $27. Others, like XForceGlobal, believe Elliott Wave analysis points to an eventual cycle top above $20.
Key Takeaway
The immediate question is whether XRP can reclaim the $3 level or whether resistance will keep it capped. If buyers cannot push price back above that mark, the focus will shift to whether $2.75 can hold as durable support.
A breakdown there could bring XRP closer to $2, wiping out much of the recent rally. At the same time, some traders are betting that the launch of new ETFs and looser monetary policy from the Federal Reserve will revive demand for risk assets, including XRP.
At the moment, the token is caught in a battle between short-term weakness and long-term optimism, and whichever side wins will define its next chapter.
At the time of writing, XRP is sitting at $ 2.86.