AST SpaceMobile (ASTS) shares are trading at $70.79 at the time of writing as the aerospace company prepares for its earnings update on August 10, 2026. Because the closest listed expiration after earnings is August 14, those contracts give the clearest view of what the options market expects around the report.
Summer Sale - Claim 70% Off TipRanks
High conviction ASTS bulls now have this Tradr ETFAt the $71 at-the-money (ATM) strike, the call costs $5.01 and the put costs $4.82. Therefore, the calculation is straightforward:
ATM straddle = $5.01 + $4.82 = $9.83
Implied move = $9.83 ÷ $70.79 = 13.89%
Upper bound = $70.79 + $9.83 = $80.62
Lower bound = $70.79 − $9.83 = $60.96
In other words, options are pricing a move of about $9.83, or 13.89%, in either direction. Importantly, an ATM straddle estimates the size of the expected move, not its direction. Therefore, the upper and lower bounds are scenario markers rather than price targets or guaranteed ranges.

How That Compares With Recent Earnings Moves
For context, ASTS has averaged a 12.75% absolute one-day move across its last eight earnings reports. Therefore, the current 13.89% implied move is 1.14 percentage points above that average. However, the range of past reactions has been extremely wide, from only 1.18% to as much as 50.70%.
This matters because the August 2024 surge heavily lifts the longer-term average. By comparison, ASTS has averaged only about a 6.95% absolute move over its most recent four earnings reports.
As a result, today’s 13.89% implied move looks much more elevated when compared with the company’s nearer-term reactions. Still, historical earnings moves are useful only as context and do not predict what will happen this time.
The Operating Numbers That Could Drive the Move
Nevertheless, the main question that investors will be asking is whether AST SpaceMobile’s revenue is accelerating enough to support its 2026 plan. In the first quarter, the company reported $14.7 million of revenue. At the same time, management kept its full-year revenue guidance at $150 million to $200 million, and said that roughly half of that range was expected to come from existing contracted backlog.
That makes second-quarter revenue especially important. Analysts currently expect about $34.5 million, which means they already assume a sharp increase from the first quarter.
Meanwhile, launch execution remains just as important as revenue. Indeed, the company is targeting about 45 BlueBird satellites in early 2027. As a result, investors will also be watching for changes in satellite production and launch schedules.
What Could Push ASTS Toward Either Boundary
Overall, a bull scenario toward or above the $80.62 upper bound would likely require several positive developments. More specifically, revenue would need to come in above the $34.5 million consensus, and management would likely need to increase its full-year outlook.
Conversely, a bear scenario toward or below the $60.96 lower bound could develop if revenue or guidance miss expectations, or if satellite deployment slips. Because execution is crucial to the investment case, disappointing progress on any major launch or commercialization milestone could also weigh down the stock.
Is ASTS Stock a Good Buy?
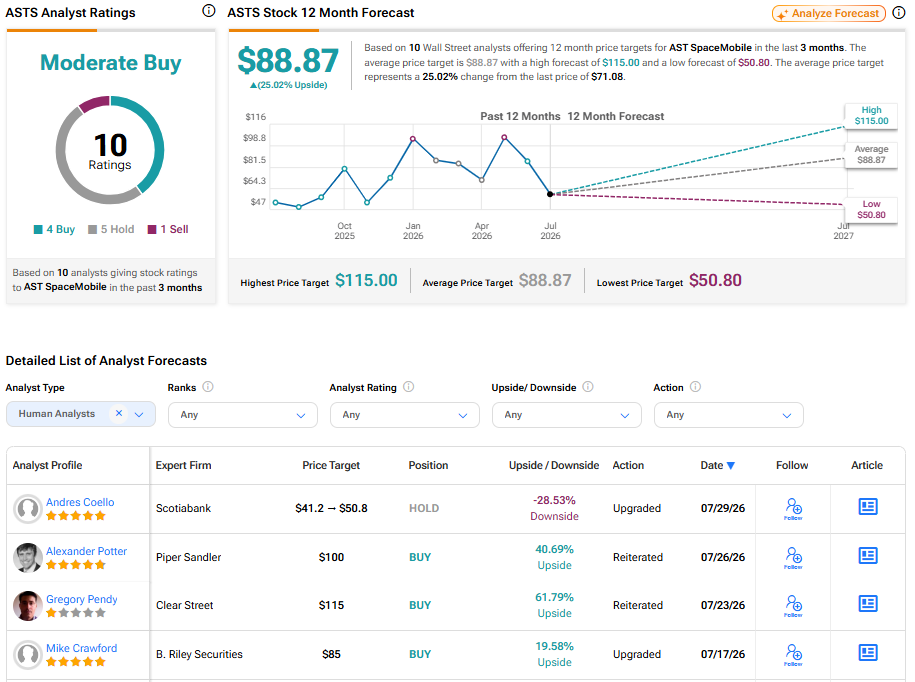
Turning to Wall Street, analysts have a Moderate Buy consensus rating on ASTS stock based on four Buys, five Holds, and one Sell assigned in the past three months, as indicated by the graphic below. Furthermore, the average ASTS price target of $88.87 per share implies 25% upside potential. (See ASTS Stock Forecast).