


The tech sector is back in 2023, riding the excitement regarding AI and other technological advances to massive gains. The Technology Select Sector SPDR ETF (NYSEARCA:XLK), which invests in the technology sector of the S&P 500 (SPX), has returned a scintillating 42.6% year-to-date. But this type of stellar performance is nothing new for this top tech ETF, which has been rewarding its investors with excellent returns for many years. So, let’s take a look at this long-term winner that is still attractive.
Elevate Your Investing Strategy:
- Take advantage of TipRanks Premium at 50% off! Unlock powerful investing tools, advanced data, and expert analyst insights to help you invest with confidence.
Stellar Track Record
XLK has established itself as a consistent, long-term winner. How good has XLK’s performance been over the years?
As of the end of the most recent quarter, XLK put up an impressive annualized total return of 19.5% over the past three years. Zooming out to five years and 10 years, the fund has managed to return over 20% on an annualized basis over each time frame, with outstanding total annualized returns of 21.5% over the past five years and 20.7% over the past 10 years.
These returns are great on their own accord, but how do they stack up against the broader market over the long term? As of the end of the most recent quarter, the Vanguard S&P 500 ETF (NYSEARCA:VOO), a good proxy for the S&P 500, returned 14.6% on an annualized basis over the past three years. Over the past five years, it has returned 12.3% on an annualized basis, and over the past 10 years, it has posted an annualized return of 12.8%.
These are solid returns, but XLK’s returns over each of the three time frames are superior, putting it among one of the rare ETFs that can say it has decisively beaten the market over the long run.
A Cost-Effective Option
XLK has given investors a market-beating performance over the past decade, and it does so for a very reasonable price, with an expense ratio of just 0.10%. This means that an investor putting $10,000 into XLK today would pay just $10 in fees in year one. Assuming the ETF returns 5% per year going forward and the fee remains 0.10%, this same investor would pay a reasonable $128 in fees over the course of the next 10 years.
It’s worth noting that XLK’s expense ratio is significantly lower than that of the Invesco QQQ Trust (NASDAQ:QQQ), the largest and most popular tech-centric ETF, which charges a still-reasonable 0.20%.
XLK’s Holdings
XLK sports 67 holdings, covering the technology sector of the S&P 500. Below, you’ll find an overview of XLK’s top 10 holdings from TipRanks’ holdings tool.

Despite the fact that it has 67 holdings, this is a fairly concentrated fund, as its top 10 holdings account for 69.5% of assets, and its top two holdings, Apple (NASDAQ:AAPL) and Microsoft (NASDAQ:MSFT), combine to make up more than 44%. This isn’t necessarily a bad thing, but investors should be aware that XLK has a lot of exposure to these two stocks.
Part of the reason that XLK has outperformed the market over the years is that its top holdings include some of the most innovative companies in the U.S. market (not to mention globally), creating the products, technologies, and applications that have revolutionized the way many people work and live their day-to-day lives.
This is true whether it’s consumer-facing products from the likes of Apple and Microsoft, enterprise-facing products from Adobe (NASDAQ:ADBE), Salesforce (NYSE:CRM) and Oracle (NYSE:ORCL), or the semiconductor companies that make many of these applications possible, like Nivida (NASDAQ:NVDA), Broadcom (NASDAQ:AVGO) and Advanced Micro Devices (NASDAQ:AMD).
You may notice that several big names are conspicuously absent from XLK’s portfolio. The likes of Amazon (NASDAQ:AMZN), Meta Platforms (NASDAQ:META), Alphabet (NASDAQ:GOOG) (NASDAQ:GOOGL), and Tesla (NASDAQ:TSLA), are not part of XLK’s portfolio.
This is because while we often think of them as tech stocks, the S&P index classifies Meta Platforms and Alphabet within communications services, and they can be found within the Communication Services Select Sector SPDR Fund (NYSEARCA:XLC).
Meanwhile, Amazon and Tesla are classified as consumer discretionary companies and can be found within the Consumer Discretionary Select Sector SDPR Fund (NYSEARCA:XLY), where they combine to make up more than 40% of the fund’s holdings.
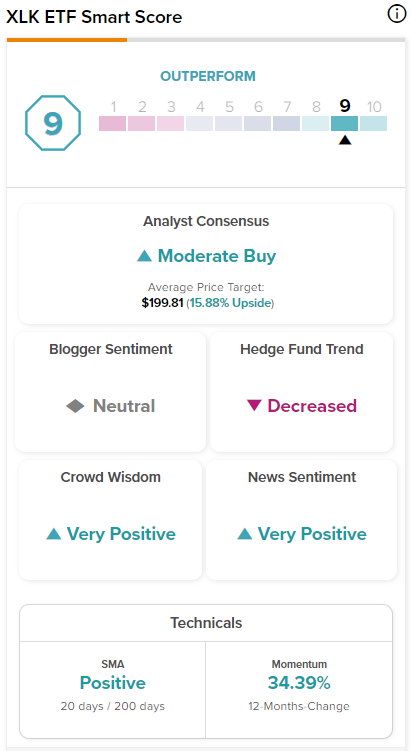
An Outperform Smart Score Rating
TipRanks’ Smart Score system rates XLK’s top holdings highly. The Smart Score is a proprietary quantitative stock scoring system created by TipRanks. It gives stocks a score from 1 to 10 based on eight market key factors. A score of 8 or above is equivalent to an Outperform rating. As you can see in the table above, an impressive eight out of XLK’s top 10 holdings have Outperform-equivalent Smart Scores of 8 or higher. XLK itself features an Outperform-equivalent ETF Smart Score of 9.
Is XLK Stock a Buy, According to Analysts?
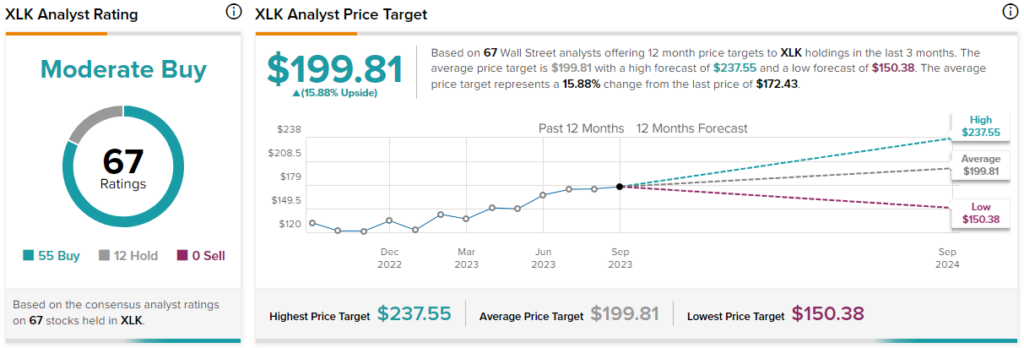
Turning to Wall Street, XLK earns a Moderate Buy consensus rating based on 55 Buys, 12 Holds, and no Sell ratings assigned in the past three months. The average XLK stock price target of $199.81 implies 15.9% upside potential.
Looking Ahead
XLK has put up a banner performance in 2023. Still, this outstanding performance is nothing new — it is one of the rare ETFs that has soundly beaten the broader market over a long period of time. The ETF enjoys favorable views from analysts and an excellent rating from TipRanks’ Smart Score System.
However, investors should be aware that while XLK owns many of today’s tech companies, it doesn’t own some of the archetypical technology stocks like Meta Platforms or Amazon, as these are grouped into different sectors by the S&P. Nevertheless, XLK’s investor-friendly expense ratio, impeccable track record, and strong portfolio of top technology companies make it look like a solid long-term bet.