


In 2023, growth stocks, primarily led by a revitalized tech sector excited by the promise of AI advancements, have been the market frontrunners. This surge is, in part, due to easing inflation concerns that previously plagued growth stocks last year.
Elevate Your Investing Strategy:
- Take advantage of TipRanks Premium at 50% off! Unlock powerful investing tools, advanced data, and expert analyst insights to help you invest with confidence.
Against this bullish backdrop, two of the market’s top growth ETFs have raced out to impressive year-to-date gains just over halfway through 2023 — the Schwab U.S. Large-Cap Growth ETF (NYSEARCA:SCHG) has returned 35.1% so far in 2023, while the Vanguard Growth ETF (NYSEARCA:VUG) has returned a slightly lower 32.8%.
So, which of these two popular blue chip growth ETFs is the better buy now?
Which Stocks Do These ETFs Hold?
SCHG is an ETF from Charles Schwab with $19.2 billion in assets under management (AUM) that invests in the Dow Jones U.S. Large-Cap Growth Total Stock Market Index. VUG is a much larger ETF from Vanguard with $92.1 billion in AUM that invests in an index that tracks the returns of large-cap growth stocks.
Both ETFs feature strong collections of top growth stocks. VUG owns 240 stocks, and its top 10 holdings make up about half of the fund. Below, you’ll find an overview of VUG’s top 10 holdings using TipRanks’ holdings tool.

Meanwhile, SCHG has a similar portfolio construction, holding 242 stocks, and its top 10 holdings make up a slightly higher 55.6% of the fund. Check out SCHG’s top 10 holdings below.
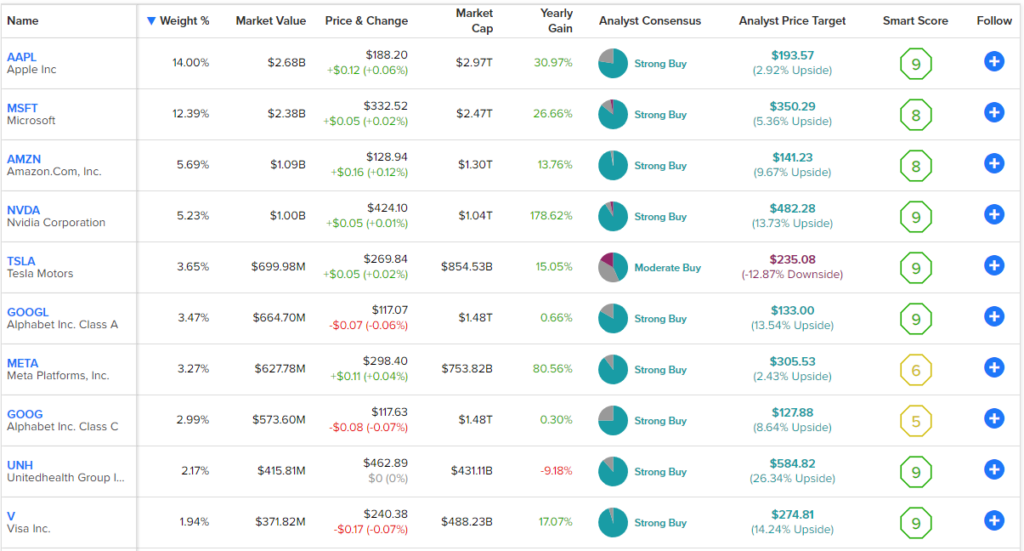
As you can see, there is plenty of overlap between the top holdings of the two funds. Both heavily feature the mega-cap technology stocks that have done much of the heavy lifting to propel the market higher all year. Apple (NASDAQ:AAPL), Microsoft (NASDAQ:MSFT), Amazon (NASDAQ:AMZN), and Nvidia (NASDAQ:NVDA) are the top four holdings for both funds, and they share eight of the same top 10 holdings.
The top holdings of both funds also feature strong Smart Scores. Nine of VUG’s top 10 holdings feature Smart Scores of 8 or better, while eight of SCHG’s do. The Smart Score is a proprietary quantitative stock scoring system created by TipRanks. It gives stocks a score from 1 to 10 based on eight market key factors. A Smart Score of 8 or higher is equivalent to an Outperform rating.
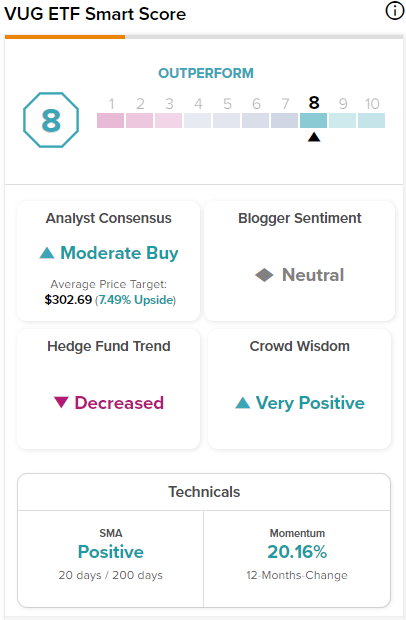
VUG and SCHG both feature ETF Smart Scores of 8 out of 10.

Both VUG and SCHG are dividend payers, although they don’t sport the types of yields that will draw in income investors. VUG currently yields 0.6%, while SCHG yields a slightly lower 0.45%.
Is VUG Stock a Buy, According to Analysts?
Turning to Wall Street, VUG has a Moderate Buy consensus rating, as 66.84% of analyst ratings are Buys, 29.84% are Holds, and 3.32% are Sells. At $302.69, the average VUG stock price target implies 7.5% upside potential.

Is SCHG Stock a Buy, According to Analysts?
Looking at SCHG, it has a Moderate Buy consensus rating, as 68.05% of analyst ratings are Buys, 28.38% are Holds, and 3.57% are Sells. At $80.35, the average SCHG stock price target implies 7.75% upside potential.

Investor-Friendly Fees
One area where these two ETFs really stand out is in terms of their fees. Both SCHG and VUG feature very attractive expense ratios. In fact, they both charge just 0.04% in fees. This is among the most advantageous fees you will find in the market today.
An investor allocating $10,000 towards SCHG or VUG would pay just a barely-noticeable $4 in fees in year one. Assuming a return of 5% a year over the next decade and that the current expense ratios remain constant, this same investor would pay only $51 in fees over 10 years.
Long-Term Performance Comparison
In addition to their low costs, these ETFs also stand out because of the impressive performances that they have put up over the long term.
As of June’s close, VUG had an impressive one-year total return of 28% and a three-year annualized total return of 12.6%. Over the past five years, it posted an excellent 14.5% annualized total return, and over the past decade, it posted an even better 14.9% annualized total return.
Moving onto SCHG, as of the end of June as well, it had a one-year total return of 30%. Further, it posted a three-year annualized total return of 14.4%, a five-year annualized total return of 15.4%, and a stellar 10-year annualized return of 15.7%. So, as good as VUG has been, as you can see, SCHG managed to outperform it over each of these time frames.
Long-time investors know that it’s very difficult to beat the market over the long run. Using the popular Vanguard S&P 500 ETF (NYSEARCA:VOO) as a proxy for the S&P 500 (SPX), both SCHG and VUG have beaten VOO’s one-year total return of 19.5%.
Meanwhile, its three-year annualized return of 14.6% is better than VUG’s but trails that of SCHG. Further, both VUG and SCHG beat VOO’s five-year annualized total return of 12.3%, and both trump its 10-year annualized total return of 12.8% as well.
Therefore, while SCHG has outperformed VUG over time, both of these ETFs are pretty good investment vehicles in that they have been beating the broader market over the long run.
Below, you’ll find a comparison of VUG and SCHG based on performance, fees, and a variety of other criteria, with VOO added in for good measure, using TipRanks’ ETF Comparison Tool, which enables investors to compare up to 20 ETFs at once.


Investor Takeaway
These are both low-fee, investor-friendly ETFs with great portfolios and great long-term performances to match. While past performance is no guarantee of future results, SCHG has beaten VUG over each of the time frames discussed above, making it the top choice between the two, but both look like great ETFs as they have both beaten the broader market over the course of the past decade.
I believe these are ETFs that investors can view as core long-term holdings that they can build their portfolios around. With growth stocks surging so far in 2023, investors can consider starting positions in these ETFs and then dollar-cost averaging into them over time during periods of market weakness.