


Many investors like the idea of getting a monthly dividend, and they are on the lookout for dividend yields that can beat inflation (currently at 6%). The Global X SuperDividend REIT ETF (NASDAQ:SRET) appeals to investors with these objectives because it ticks both of these boxes (it yields 8.5%), but there are also several reasons for investors to be cautious here. Therefore, let’s weigh the pros and cons of this high-yield ETF.
Elevate Your Investing Strategy:
- Take advantage of TipRanks Premium at 55% off! Unlock powerful investing tools, advanced data, and expert analyst insights to help you invest with confidence.
High-Yielding Monthly Dividend
By far, SRET’s biggest selling point is its impressive dividend yield of 8.5% and its monthly payout schedule. This massive dividend yield trumps the rate of inflation. It’s also five times the average dividend yield of the S&P 500 (SPX), which currently yields 1.7%, and it’s almost 2.5 times the yield of the 10-year Treasury note (currently about 3.5%), making this a compelling play from an income perspective.
The Global X SuperDividend REIT ETF also deserves credit for its consistent track record when it comes to paying a monthly dividend. It has paid investors a distribution every month for eight years in a row.
Diversification
With 31 holdings, SRET doesn’t stand out as being particularly diversified from a total holdings perspective. On the other hand, SRET’s top 10 holdings make up just 36.9% of the fund, meaning that it isn’t overly concentrated towards just its top holdings, as is the case with some ETFs. The ETF “seeks to provide investment results that correspond generally to the price and yield performance, before fees and expenses, of the Solactive Global SuperDividend REIT Index.” It invests in “30 of the highest-yielding REITs in the world” in order to generate income.
REITs are real estate investment trusts, companies that own, operate, or finance income-producing real estate. This could be anything from an apartment building to farmland. These vehicles allow investors to passively invest in real estate at a large scale, something that would be difficult to do without significant capital without using a REIT.
Additionally, REITs allow investors to access real estate as an investment without the headaches that typically come along with being a landlord. Generally speaking, investors typically invest in REITs for their dividend payouts more than for their potential capital appreciation, but every REIT is different.
While SRET is specifically focused on REITs as opposed to a diversified or broad-market ETF for generalist investors, it does offer plenty of diversification within REITs, with holdings encompassing diversified REITs, healthcare REITs, mortgage REITs, office REITs, retail REITs and more.
SRET is also geographically diversified. 56% of the fund’s holdings are U.S.-based. Meanwhile, Singapore-based equities make up another 16.8% of the fund, and the rest of the fund is comprised of equities from Europe, Australia, Mexico, Canada, South Africa, and Great Britain. This gives U.S. dividend investors a chance to gain some exposure to markets outside of their home market.
Below is an overview of SRET’s top 10 holdings using TipRanks’ Holdings tool.
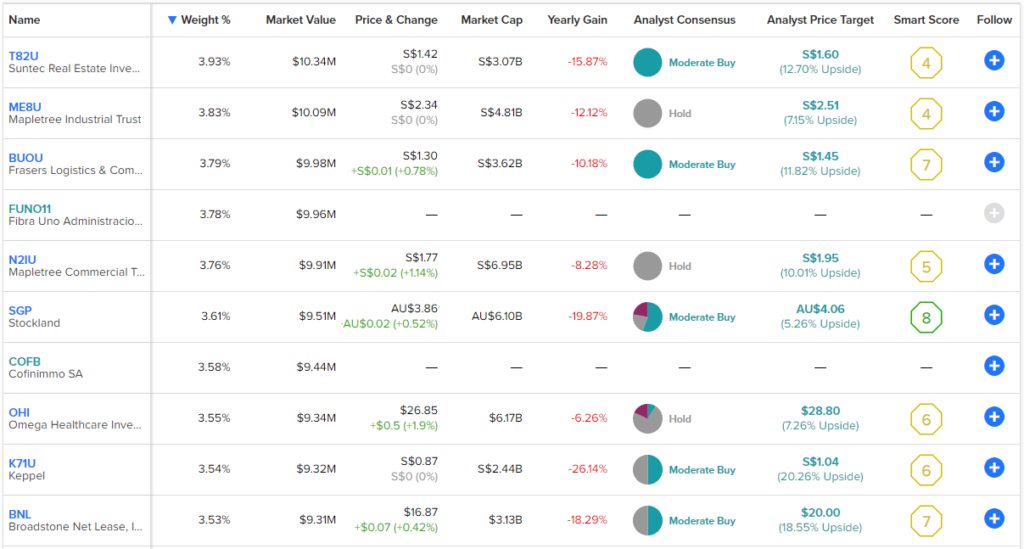
Looking at the top 10 holdings gives me some reason for caution, however. For instance, the top two holdings, Suntec Real Estate Investment (SG:T82U) and Mapletree Industrial Trust (SG:ME8U), have relatively underwhelming Smart Scores of 4 out of 10.
The Smart Score is TipRanks’ proprietary quantitative stock scoring system that evaluates stocks on eight different market factors. The score is data-driven and does not involve any human intervention. Only one of the stocks from the image above, Stockland (AU:SGP), has a Smart Score of 8 or above (an Outperform rating).
SRET’s Long-Term Performance
While SRET stock offers an attractive yield and diversification in its own way, here’s the other reason why I’m cautious about it: it has not produced great results over the long term.
This is evident when looking at SRET from a total-return perspective, which accounts for dividend payments in addition to stock price performance. As of the end of the most recent quarter, SRET had lost 18.3% for the previous year, even when taking its generous dividend payout into account.
Over a three-year timeframe, SRET lost 16.1% per year, and over a five-year timeframe, it was down 7.3% per year. Since its inception in 2015, SRET has underwhelmed with a total return of -1.45% per year. So, even with these sizable dividend payouts, investors have still lost money over each of these time frames with SRET.
While the loss of -1.45% per year since inception in 2015 may not sound like the worst thing in the world, think of the cost in terms of opportunity and time. Investing in SRET instead of simply putting the same money into the S&P 500 index would have come with a tremendous opportunity cost, as this index has returned 117.3% since SRET’s inception in March 2015.
Therefore, investors would have been much better off just investing in the S&P 500. Add in the fact that you would have been paying SRET’s 0.59% expense ratio each year, and the investment becomes even less palatable.
What is the Price Target for SRET Stock?
Wall Street analysts also have a tepid view of SRET. Of the 115 analyst ratings on the ETF, 40% are Buys, 52.17% are Holds, and 7.83% are Sells. Thus, the consensus rating for SRET is a Hold. However, the average SRET stock price target of $24.86 does indicate upside potential of nearly 20% from its current price.
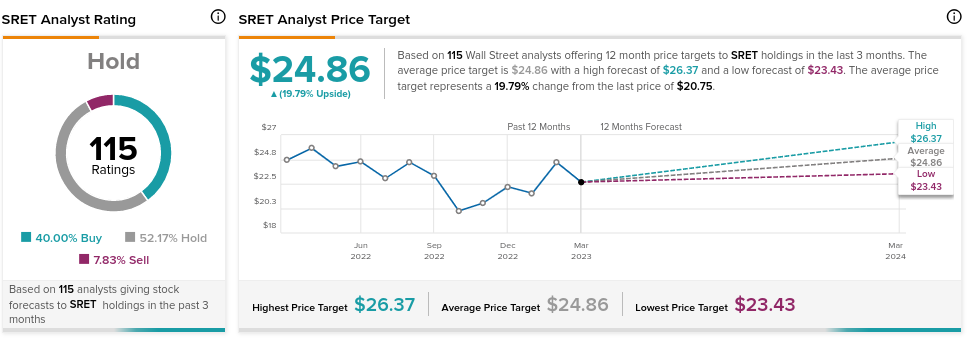
TipRanks uses proprietary technology to compile analyst forecasts and price targets for ETFs based on a combination of the individual performances of the underlying assets. Further, TipRanks calculates a weighted average based on the combination of all the ETFs’ holdings. The average price forecast for an ETF is calculated by multiplying each individual holding’s price target by its weighting within the ETF and adding them all up.
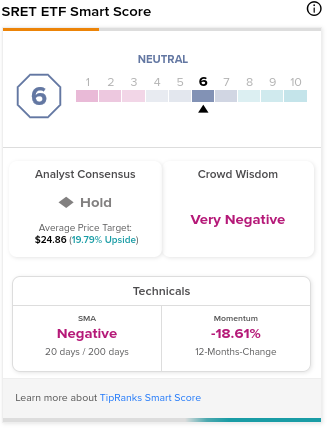
Additionally, several other indicators that TipRanks monitors show that investors may want to proceed with caution. SRET has a Neutral ETF Smart Score of 6 out of 10, and Crowd Wisdom is Very Negative.
Looking Ahead
SRET does look appealing based on its significant monthly dividend that it has paid out like clockwork for eight years. It’s also intriguing in that it combines this with a way for U.S. investors to gain international exposure.
However, the ETF’s subpar track record over the years leaves a lot to be desired, and while past performance is no guarantee of future results, the tepid Smart Scores of its top holdings lead me to believe that this performance isn’t likely to stage a drastic turnaround in the near future. For these reasons, I would probably look elsewhere when looking to add dividend income to my portfolio.