


ETFs that pay monthly dividends and utilize a strategy of selling covered calls to generate income have grown in popularity in recent years. While this strategy is receiving an influx of attention, it isn’t necessarily new. In fact, an ETF called the Global X NASDAQ 100 Covered Call ETF (NASDAQ:QYLD), launched in 2013, currently boasts an eye-catching yield of 12%.
While the ETF holds appeal for income investors, there are also several things that investors should be aware of before jumping in right after seeing that eye-popping yield. Let’s take a closer look at this monthly dividend payer from Global X and whether it could be a fit for your portfolio.
Monster Dividend
From a pure income perspective, it’s hard to beat QYLD’s yield of 12%. This double-digit yield is more than twice the rate of inflation, and it dwarfs the average yield of the S&P 500 and the yield of the ten-year treasury. It also beats the yields of many other popular dividend and high-yield ETFs. Furthermore, QYLD has a reliable track record in that it has paid monthly dividends to investors for nine years in a row.
High-Scoring Holdings
As a fund focused on the NASDAQ 100 index, you won’t be surprised to find that QYLD’s top holdings consist largely of the mega cap tech stocks that dominate the tech-centric index. Tech behemoths like Microsoft and Apple enjoy double-digit weightings here, while other top tech stocks like Amazon, Nvidia, both share classes of Alphabet, Meta Platforms, Tesla, and Broadcom are all top-ten holdings.
It’s not until the tenth-largest position, Pepsi, that you come across a non-tech stock.
Below, you’ll find an overview of QYLD’s top holdings, using TipRanks’ holdings screen.
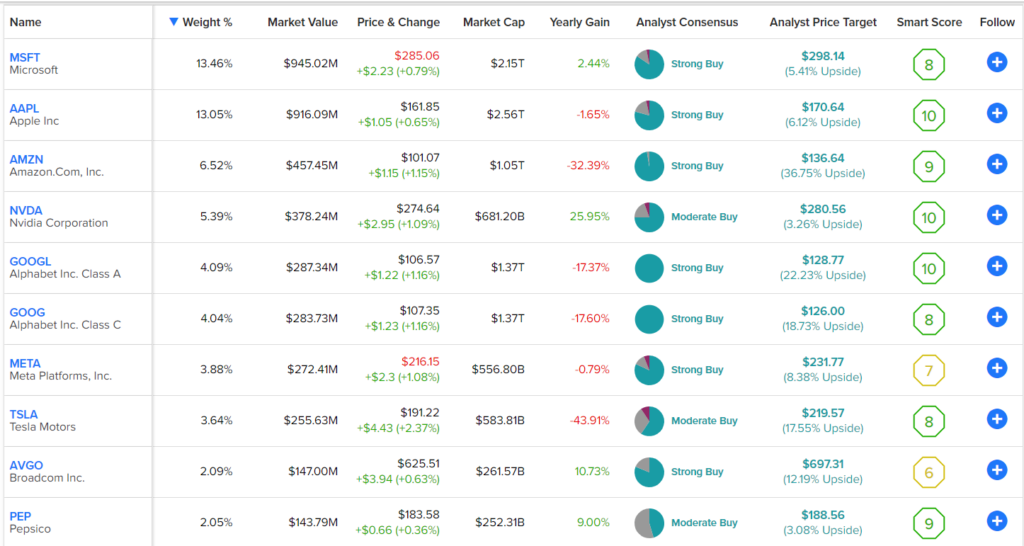
One thing that stands out about QYLD’s top holdings is that you’ll find a lot of impressive Smart Scores here. QYLD owns a strong collection of blue chip tech and growth stocks. Apple, Nvidia, and Alphabet shares all have perfect 10 out of 10 ratings, while Microsoft, Amazon, Tesla, and Pepsi all have smart scores of 8 or above, which is equivalent to an Outperform rating.
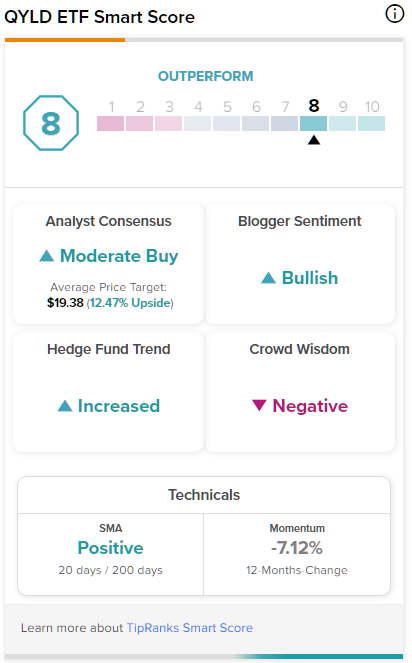
To this end, QYLD has earned an impressive ETF Smart Score of 8 out of 10, reflecting several positive indicators such as bullish blogger sentiment and growing hedge fund involvement.
Smart Score is TipRanks’ proprietary quantitative stock scoring system that evaluates stocks on eight different market factors. The result is data-driven and does not involve any human intervention.
The Strategy Behind QYLD’s Double-Digit Yield
After looking through QYLD’s top holdings, you might be noticing that outside of Pepsi and perhaps Broadcom, none of these names are really noted as dividend stocks (many don’t pay a dividend at all), and wondering how QYLD generates a double-digit yield from this basket of holdings.
QYLD implements a strategy known as a “covered call” or “buy-write,” whereby the fund purchases stocks from the Nasdaq 100 Index and simultaneously sells corresponding call options on the same index.
Essentially, QYLD is selling covered calls against the positions it owns and it collects options premiums to generate additional income and achieve this high yield. This isn’t a bad strategy; it’s similar to the ones employed by JPMorgan Equity Premium Income ETF (NYSEARCA:JEPI) and JPMorgan Nasdaq Equity Premium Income ETF (NASDAQ:JEPQ), and it certainly generates a high yield.
However, one thing that investors should be aware of is that as is the case with JEPI and JEPQ, selling covered calls against these positions will likely limit some of QYLD’s upside in an environment where tech and growth stocks are surging.
Long-term Performance
The possibility of capped upside is one cause for concern that investors should be aware of. The other is the ETF’s long-term performance. With annualized total returns of about 6.7% since inception in 2013, QYLD investors have made money. However, while they didn’t lose money, there is an opportunity cost — QYLD has underperformed the NASDAQ 100 itself (its benchmark index), and it has underperformed simply investing in the S&P 500. While past performance is no guarantee of future results, this is just something that investors should keep an eye on.
Further to this point, QYLD’s expense ratio of 0.6% is far more expensive than the expense ratios of these simple broad-market strategies which have outperformed it over time — QQQ has an expense ratio of 0.2%, while SPY’s is just 0.09%.
What is the Price Target for QYLD?
According to Wall Street analysts, QYLD is currently rated as a Moderate Buy, with an average price target of $19.38. This target represents an upside potential of approximately 13% from the ETF’s current market value.

TipRanks uses proprietary technology to compile analyst forecasts and price targets for ETFs based on a combination of the individual performances of the underlying assets. Further, TipRanks calculates a weighted average based on the combination of all the ETFs’ holdings. The average price forecast for an ETF is calculated by multiplying each individual holding’s price target by its weighting within the ETF and adding them all up.
Investor Takeaway
QYLD certainly has some things going for it, like its outsize yield and its collection of blue chip with strong Smart Scores. However, like almost any strategy, it has its pros and cons, and the two main drawbacks here is the limited upside potential thanks to the covered call strategy and the fund’s long-term performance, which has lagged the strategy of simply investing in the NASDAQ or S&P 500 while costing investors more in the process.
For a dividend investor specifically looking to add yield to their portfolio, QYLD is an option to consider, and I give it credit for its reliable long-term history of monthly payouts. However, I personally am not looking to dive in solely based on the yield and I wouldn’t allocate a large portion of my portfolio to it based on these factors.