


The iShares Expanded Tech Sector ETF (NYSEARCA:IGM) is a comprehensive ETF that gives investors exposure to the full spectrum of the North American tech sector, as it includes key tech-related stocks that aren’t always included in tech ETFs. I believe this $3.1 billion ETF from BlackRock’s (NYSE:BLK) iShares is a good way to invest in a broad swath of the tech sector and an attractive investment opportunity overall. Let’s dive in.
Elevate Your Investing Strategy:
- Take advantage of TipRanks Premium at 55% off! Unlock powerful investing tools, advanced data, and expert analyst insights to help you invest with confidence.
What is IGM ETF’s Strategy?
According to iShares, IGM seeks to give investors “broad exposure to the technology sector, and technology-related companies in the communication services and consumer discretionary sectors,” and it invests in “hardware, software, internet marketing, interactive media, and related companies.”
This inclusion of “technology-related companies in the communication services and consumer discretionary sectors” is key, as it gives investors exposure to stocks that are often conspicuous in their absence from other tech ETFs, as we’ll discuss below.
IGM’s Top Holdings
As the name implies, IGM invests in an expanded swath of the tech sector. The ETF holds 280 positions, and its top 10 holdings account for 54.2% of the fund. Below, you’ll find an overview of IGM’s top 10 holdings using TipRanks’ holdings tool.

As you can see, Alphabet (NASDAQ:GOOGL) is the fund’s top holding, followed by other blue-chip technology stocks like Apple (NASDAQ:AAPL), Microsoft (NASDAQ:MSFT), Nvidia (NASDAQ:NVDA) and Meta Platforms (NASDAQ:META).
The inclusion of Alphabet and Meta Platforms is notable. While these are often some of the first names that come to mind when we think of technology stocks, they are not always found in other leading tech ETFs.
This is because many indices classify these stocks within the communications services sector. Because of this, you’ll find that top tech ETFs like the Technology Select Sector SPDR ETF (NYSEARCA:XLK) eschew Alphabet and Meta Platforms. These stocks are instead found in the Communication Services Select Sector SDPR Fund (NYSEARA:XLC), which groups them with companies like AT&T (NYSE:T) and Verizon (NYSE:VZ).
Other top tech ETFs like the Fidelity MSCI Information Technology ETF (NYSEARCA:FTEC) and the iShares Global Tech ETF (IXN) also pass over these types of stocks. These are all good ETFs, but they all have different ways of classifying what is and isn’t a technology stock.
Meanwhile, the Invesco QQQ Trust (NASDAQ:QQQ), another top tech ETF, gives investors access to all of these stocks. However, it’s important to note that QQQ simply invests in the Nasdaq 100 (NDX) index, which is not exclusive to tech stocks, so the fund has large positions in non-tech stocks like Pepsi (NASDAQ:PEP) and Costco (NASDAQ:COST).
This isn’t a bad thing per se, but it’s important to note that this means QQQ isn’t a pure play on technology, even though the name QQQ has, in many ways, become synonymous with tech investing.
Because IGM’s underlying index, the S&P North American Expanded Technology Sector Index, includes technology-related stocks in the communications services and consumer discretionary sectors, these stocks are present here, which in my view, gives investors a more holistic, all-encompassing picture of the tech sector.
My only qualm about IGM’s portfolio is that while it gives investors broad exposure to the tech sector, it doesn’t own Amazon (NASDAQ:AMZN), even though this would seem to fit the definition of a technology-related company in the consumer discretionary sector.
Overall, this strategy results in a strong group of holdings, as evidenced by the fact that seven out of IGM’s top 10 holdings feature Outperform-equivalent Smart Scores of 8 or above. The Smart Score is a proprietary quantitative stock scoring system created by TipRanks. It gives stocks a score from 1 to 10 based on eight market key factors. A score of 8 or above is equivalent to an Outperform rating.
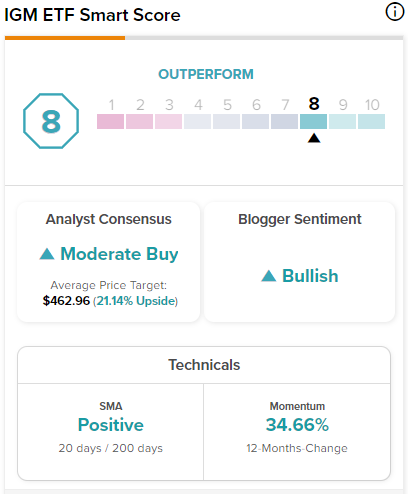
IGM itself features an Outperform-equivalent ETF Smart Score of 8 out of 10.
As you’ll see below, the analyst community is optimistic as well.
Is IGM Stock a Buy, According to Analysts?
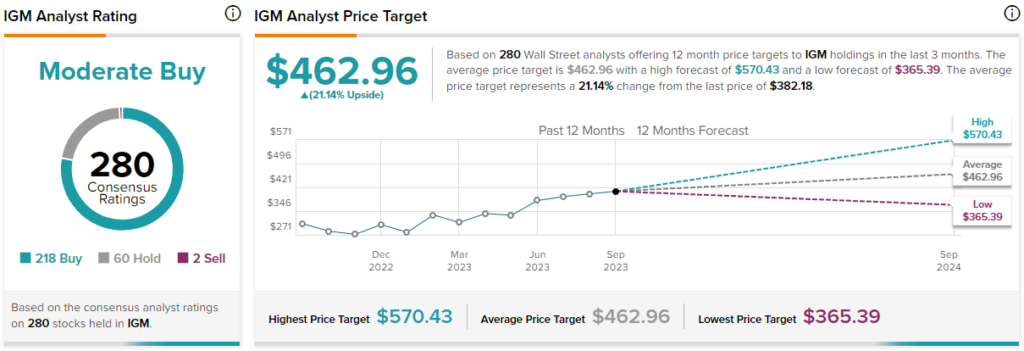
Turning to Wall Street, IGM earns a Moderate Buy consensus rating based on 218 Buys, 60 Holds, and two Sell ratings assigned in the past three months. The average IGM stock price target of $462.96 implies 21.3% upside potential.
Performance
How has IGM performed over time? Pretty well. IGM has returned 38.8% over the past year. Over the past three years, the fund’s annualized return stands at 7.8% (as of the end of August). Zooming out to five years, IGM has returned a more exciting 14.6% on an annualized basis, and over the past 10 years, it has returned an even better 18.9% on an annualized basis.
These results compare favorably with those of the broader market. For context, the SPDR S&P 500 ETF (NYSEARCA:SPY), has returned 10.4% over the past three years, 11.0% over the past five years, and 12.7% over the past 10 years.
It’s also worth comparing IGM to other leading tech-specific ETFs like the aforementioned XLK and QQQ. QQQ’s annualized returns over the past three, five, and 10 years come in at 9.3%, 16.0%, and 18.6%, respectively, meaning that IGM trails QQQ over the past three and five years but slightly outperforms it over the past 10 years.
Meanwhile, XLK has outperformed IGM over the past three years with an annualized return of 13.4%, over the past five years with an annualized return of 19.6%, and over the past 10 years with an annualized return of 20.5%.
Ultimately, IGM has slightly outperformed QQQ over a 10-year period and slightly underperformed XLK over the same horizon. But overall, all three of these ETFs have been good performers.
Investing in a fund that is putting up returns of nearly 20% over the course of 10 years will really grow the value of one’s portfolio over time. To illustrate this point, an investor who put $10,000 into IGM in August of 2013 would have $56,400 as of the end of August 2023.
Lastly, IGM has been around for a long time and has generated a near double-digit annualized return of 9.6% since its inception in 2001, turning an initial investment of $10,000 into almost $80,000.
One Notable Downside
The most notable downside of IGM is its expense ratio of 0.41%. While this is a reasonable expense ratio, it’s also higher than that of some of the major aforementioned tech ETFs like XLK and QQQ, which charge 0.10% and 0.20%, respectively.
An investor putting $10,000 into IGM would pay $41 in fees during year one versus $10 for an investor putting the same amount into XLK and $20 for an investor allocating the same amount into QQQ.
The difference in these fees becomes more apparent over time. Assuming that each fund maintains its current expense ratio and returns 5% per year going forward, the same IGM investor would pay $518 in fees over the course of 10 years versus $128 for the XLK investor and $255 for the QQQ investor.
Looking Ahead
IGM gives investors all-encompassing exposure to the technology sector, including stocks like Alphabet, Meta Platforms, and others that many top tech ETFs pass on because they do not classify them as technology stocks. The fund is fairly diversified and has generated strong returns for a prolonged time frame, making it an attractive investment option for investors. The primary downside is that its expense ratio is a bit higher than some of its major competitors, but it’s not an egregious fee.