The T. Rowe Price Blue Chip Growth ETF (NYSEARCA:TCHP) is a relatively new, growth-oriented ETF from asset manager T. Rowe Price (NASDAQ:TROW) that has raced out to an impressive gain of nearly 40% year to date. There’s a lot to like about the ETF, but there are also some considerations that investors should think about before deciding whether to invest. Let’s take a look at why.
Elevate Your Investing Strategy:
- Take advantage of TipRanks Premium at 50% off! Unlock powerful investing tools, advanced data, and expert analyst insights to help you invest with confidence.
What Does the TCHP ETF Do?
Launched in 2020, TCHP is a growth ETF from T. Rowe Price that “seeks to provide long-term capital growth” with income as a “secondary objective.” According to T. Rowe Price, TCHP “focuses on companies with leading market positions, seasoned management, and strong financial fundamentals.”
TCHP’s Top Holdings
TCHP holds 78 positions, but its top 10 holdings account for 63% of assets, so the fund is fairly concentrated. In fact, its top two positions, Microsoft (NASDAQ:MSFT) and Apple (NASDAQ:AAPL), combine to make up roughly 25% of the fund. TCHP isn’t alone in this regard, as Apple and Microsoft have accrued massive market caps with their gains this year and dominate the top holdings of many ETFs, but it’s one thing that investors should be aware of.
Below, you can take a look at TCHP’s top 10 holdings using TipRanks’ holdings tool.

As you can see, outside of Apple and Microsoft, the rest of TCHP’s top holdings are dominated by other mega-cap tech names like Amazon (NASDAQ:AMZN), Nvidia (NASDAQ:NVDA), Alphabet (NASDAQ:GOOGL), Meta Platforms (NASDAQ:META) and Tesla (NASDAQ:TSLA), along with several other popular growth names like Visa (NYSE:V), Mastercard (NASDAQ:MA), and UnitedHealth Group (NYSE:UNH).
As you can see, these holdings boast some pretty impressive Smart Scores across the board. The Smart Score is a proprietary quantitative stock scoring system created by TipRanks. It gives stocks a score from 1 to 10 based on eight market key factors. A score of 8 or above is equivalent to an Outperform rating. An admirable seven out of TCHP’s top 10 holdings feature Smart Scores of 8 or above.
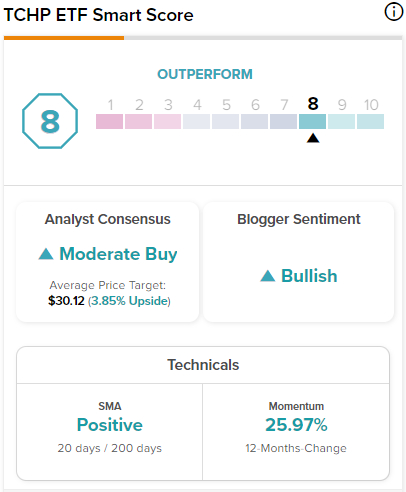
TCHP itself features an Outperform-equivalent ETF Smart Score of 8 out of 10.

Is TCHP Stock a Buy, According to Analysts?
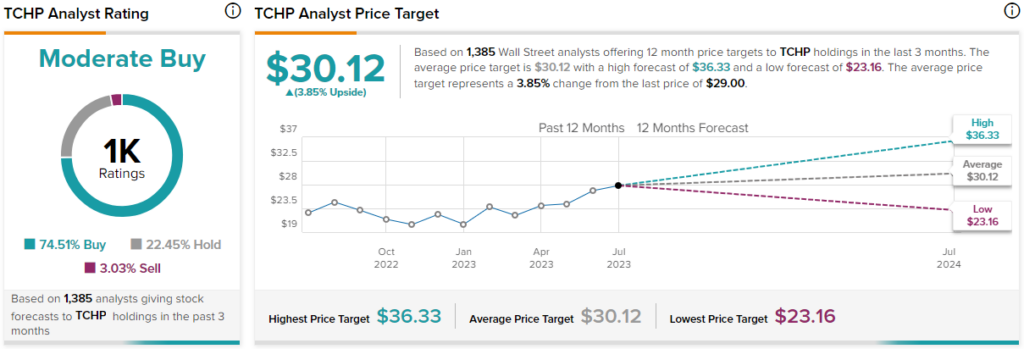
Turning to Wall Street, TCHP has a Moderate Buy consensus rating, as 74.51% of analyst ratings are Buys, 22.45% are Holds, and 3.03% are Sells. At $30.12, the average TCHP stock price target implies 3.85% upside potential.

A Lot to Like, But…
With a strong portfolio, favorable views from analysts, and an Outperform-equivalent Smart Score, there is a lot to like about TCHP. However, looking beneath the surface, there is one major caveat that investors should consider before investing.
With a list of top holdings dominated by Microsoft, Apple, and other mega-cap tech stocks, TCHP isn’t all that different from many of the much larger and more well-known growth ETFs out there, like the Vanguard Growth ETF (NYSEARCA:VUG), the Schwab U.S. Large-Cap Growth ETF (NYSEARCA:SCHG), or even top tech ETFs like the Invesco QQQ Trust (NASDAQ:QQQ), for that matter.
There is plenty of overlap between these funds — in fact, TCHP and VUG share eight of the same top 10 holdings, TCHP and SCHG share nine of the same top 10 holdings, and TCHP and QQQ share seven of the same top 10 holdings.
As you can see, TCHP isn’t particularly differentiated from these popular funds. This wouldn’t be a major issue in and of itself if it wasn’t for another concern — TCHP has a significantly higher expense ratio than each of these three alternatives. Now, TCHP is actively managed, so of course, it is going to have a higher expense ratio than these index ETFs, but with so much overlap between the funds, it’s somewhat difficult to make the case for a significantly higher expense ratio.
How much higher is it? TCHP has an expense ratio of 0.57%. This is over 10 times higher than the expense ratios for VUG and SCHG, which both charge just a minuscule 0.04%. It’s also nearly three times higher than QQQ’s expense ratio of 0.20%.
Clearly, TCHP is more expensive, but what does this look like on the ground? An investor putting $10,000 into TCHP would pay $57 in fees in year one, while an investor in QQQ would pay $20, and an investor in VUG or SCHG would pay just $4.
The disparity becomes even more pronounced over time as these fees compound over the years. Assuming the fees remain the same and each ETF returns 5% per year over the next ten years, the SCHG and VUG investors would pay just $51 in fees over the course of the decade. The QQQ investor would pay $255 in fees, and the TCHP investor would pay a significantly higher $714 in fees over a 10-year time frame.
Again, in fairness to TCHP, it is actively managed, so its fees are going to be higher than for an index ETF, but this is a pretty significant gap, especially given the fact that these funds don’t look significantly different from a holdings perspective.
Furthermore, while they have low fees, QQQ, VUG, and SCHG have all been around for a long time and compiled excellent long-term track records when it comes to performance, with all three offering investors double-digit annualized returns for a decade or more. On the other hand, TCHP has only been around since 2020, so it has not yet compiled this type of reliable track record.
Investor Takeaway
None of this is to pick on TCHP, as it seems like a good fund and could yet go on to establish a fine track record of its own over the years, but it is worth pointing out that there are plenty of alternatives that offer investors similar exposure with lower costs and with longer track records. In and of itself, TCHP looks like a perfectly fine ETF, but investment opportunities never exist in a vacuum, and it’s always important to consider alternatives.


