
The SPDR S&P 500 ETF Trust (SPY), a top ETF (Exchange Traded Fund), represents a basket of 500 companies across a broad range of market sectors, from information technology to health care to consumer discretionary, financials, and more. While SPY has increased 10.5% year-to-date, technical indicators indicate further upside potential.
Pick the best stocks and maximize your portfolio:
- Discover top-rated stocks from highly ranked analysts with Analyst Top Stocks!
- Easily identify outperforming stocks and invest smarter with Top Smart Score Stocks
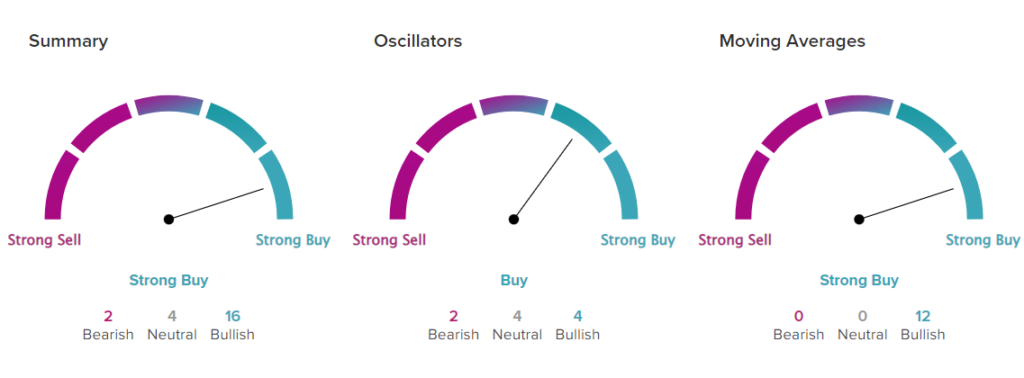
According to TipRanks’ technical analysis tool, the SPDR S&P 500 ETF Trust’s 50-Day EMA (exponential moving average) is 407.32, while its price is $419.23, making it a Buy. Further, the short-duration EMA (20-day) also signals a Buy.
While the moving averages indicate a Buy, its RSI (Relative Strength Index) is 57.36, implying a Neutral signal. Nevertheless, a positive Price Rate of Change (ROC) generally points to a bullish trend. Thus, the SPY’s ROC of 0.68 creates a Buy signal.
In a nutshell, SPY is a Buy based on TipRanks’ easy-to-read technical summary signals (which combine the moving averages and the technical indicators into a single, summarized call).
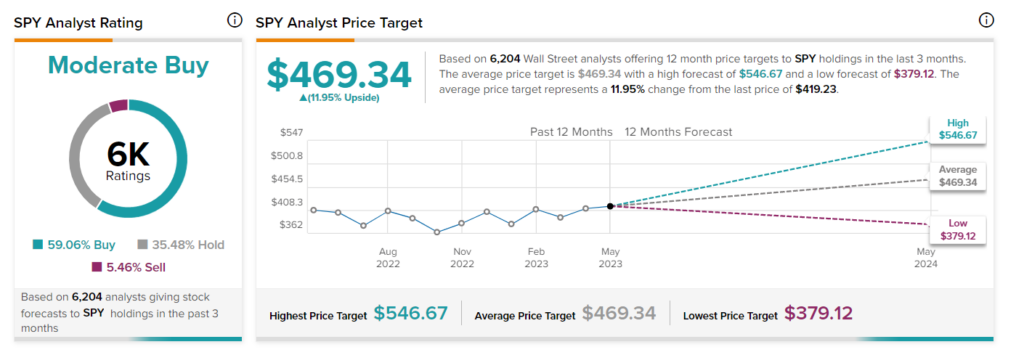
Is SPY a Buy, Hold, or Sell?
SPY has a Moderate Buy analyst consensus rating on TipRanks, and the average price target of $469.34 implies 11.95% upside. Among the 6,204 analysts providing ratings on 505 holdings of SPY, 59.06% have given a Buy rating, 35.48% have assigned a Hold rating, and 5.46% have given a Sell rating.
Impressively, SPY has a low expense ratio of 0.09%, which is attractive. Moreover, according to TipRanks’ Smart Score System, SPY has a smart score of eight, which indicates that the ETF could outperform the broader market over the long term.