Many investors are familiar with the S&P 500 (SPX). It’s the hallmark index that tracks 500 of the top companies. The index has several parameters for inclusion, such as a $12.7 billion market cap and profitability in the most recent quarter and the most recent year. Investors often use index funds to achieve market returns instead of outperforming the market. While there are plenty of reasons for S&P 500 investors to feel bullish about the index, they may want to consider the S&P 50 instead.
Elevate Your Investing Strategy:
- Take advantage of TipRanks Premium at 50% off! Unlock powerful investing tools, advanced data, and expert analyst insights to help you invest with confidence.
I am bullish on both of these funds, but the S&P 50 has a history of producing higher returns.
What Is the Difference Between the S&P 50 and the S&P 500?
The main difference between these funds is that the S&P 500 contains 500 stocks, while the S&P 50 only consists of 50 stocks. The S&P 50 holds the top 50 companies within the S&P 500 based on market cap.
Fewer holdings allow the S&P 50 to concentrate more heavily on its investments. For instance, the Magnificent Seven stocks have a higher percentage of total assets within the S&P 50 compared to the S&P 500. To demonstrate how this works, this article will analyze the Invesco S&P 500 Top 50 ETF (NYSEARCA:XLG) and the SPDR S&P 500 ETF Trust (NYSEARCA:SPY).
Microsoft (NASDAQ:MSFT) is the top holding for both funds since it has the highest market cap. SPY has 7.2% of its total assets in the tech giant. However, XLG spreads its money across fewer stocks and can allocate 12.4% of its capital into Microsoft stock.
Broadcom (NASDAQ:AVGO) is the 10th holding for each of these funds. While SPY has a 1.33% concentration in the stock, XLG has a much higher 2.46% concentration in the stock.
Investors will also see significant differences in asset allocation based on sectors. Both funds have information technology as the largest sector, but the gap is wide. XLG has 41.9% of its capital allocated in this sector, while SPY only has 30.9% of its holdings in the same industry.
The gap comes from XLG’s lack of focus on other industries like materials (0.87%), utilities (0.45%), and industrials (0.08%). These industries often feature lower growth rates but are more resilient during economic challenges. Meanwhile, SPY has at least 2% of its capital allocated to each of these industries. The S&P 500 fund also has 8.3% of its assets invested in the industrial sector.
What About the Returns?
XLG has consistently outperformed SPY during bull markets. While XLG is up by 41% over the past year, SPY has only gained 28% in the same amount of time. The gap between these funds’ five-year gains is even more pronounced. The SPY’s five-year gain of 102.5% has not kept up with XLG’s 5-year gain of 125.8%.
While the S&P 50 is the clear winner during periods of economic strength, contractions can offer slight upside for the S&P 500, comparatively speaking. XLG lost approximately 25% in 2022 during a down year for many tech stocks. However, SPY only lost roughly 20% of its value during the same amount of time.
Risks to Consider
Both of these funds are positioned to the point where it’s Magnificent Seven or bust. There are a few additional stocks investors have to monitor within these funds, but the top 10-15 stocks are doing most of the work.
As long as the Magnificent Seven stocks continue to perform well, both of these funds will flourish. However, the S&P 50 has more upside since it is more heavily concentrated in those high-growth stocks. The S&P 500 spreads its funds across an additional 450 stocks, which may be more diversification than most investors need.
If you buy shares of a fund that tracks the S&P 50, there is a stronger emphasis on Information Technology. This sector must continue to perform well for the S&P 50 to outperform the S&P 500.
Is XLG Stock a Buy, According to Analysts?
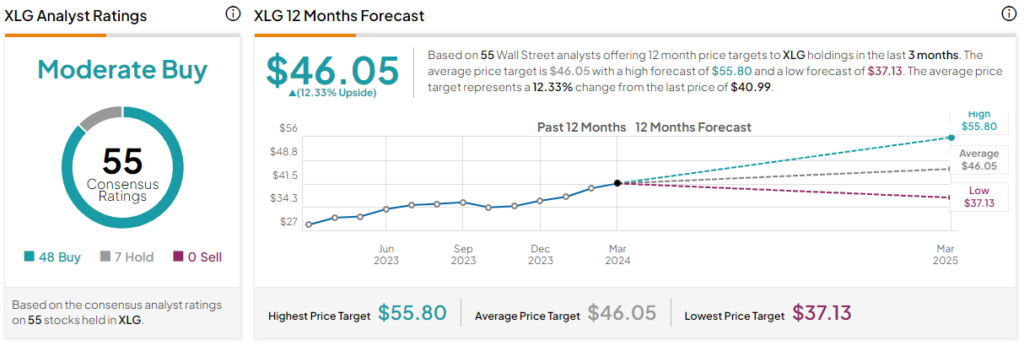
XLG is rated as a Moderate Buy based on 48 Buys and seven Hold ratings assigned in the past three months. The average XLG stock price target of $46.05 implies 12.3% upside potential.

Is SPY Stock a Buy, According to Analysts?
SPY is also rated as a Moderate Buy, with 387 Buys, 108 Holds, and nine Sell ratings assigned in the past three months. The average SPY stock price target of $561.19 implies 10.5% upside potential.

The Bottom Line on the S&P 50 and the S&P 500
Both indices have proven to be reliable for long-term investors. The S&P 500 prioritizes the top 500 qualifying companies, while the S&P 50 only considers the top 50 qualifying companies based on market cap.
Analysts feel more optimistic about the S&P 50, and ETFs following that benchmark have outperformed the S&P 500 over several years. The S&P 50 holds a higher percentage of growth stocks that have established themselves as industry leaders. However, the S&P 500 also holds onto many low-risk stocks that don’t generate as much growth.
Investors looking to maximize their returns may want to consider the S&P 50. Again, though, the S&P 500 is likely a better candidate for economic downturns.


