


The iShares Semiconductor ETF (NASDAQ:SOXX) and the Van Eck Semiconductor ETF (NASDAQ:SMH) have a lot in common. First and foremost, they both invest in the semiconductor space, but the similarities go beyond their thematic focus. They are very close in terms of assets under management (AUM); SOXX has $7.2 billion under management, while SMH has $7.4 billion. They even feature identical, reasonable expense ratios of 0.35%, although this is probably less of a coincidence since their managers know that they are competing for the same capital.
Elevate Your Investing Strategy:
- Take advantage of TipRanks Premium at 50% off! Unlock powerful investing tools, advanced data, and expert analyst insights to help you invest with confidence.
The semiconductor space continues to offer plenty of growth potential over the long term, and valuations in the sector have come down after last year’s tech sell-off. For investors looking to capitalize on the industry’s long-term trajectory, which ETF offers the better way to play it?
These ETFs are strikingly similar, and because they are thematic ETFs investors use to express a view on the same industry, they will likely trade in fairly close correlation most of the time. However, a few minor distinctions between the two provide one with a slight but tangible edge over the other, in my eyes. Let’s see why.
SOXX and SMH’s Holdings
Neither of these ETFs is particularly diversified across industry or sector, but that’s because they are both focused exclusively on semiconductors.
Below, you’ll find charts that give you an overview of each ETF’s top 10 holdings using TipRanks’ holdings screen, which gives investors a comprehensive overview of an ETF’s holdings.
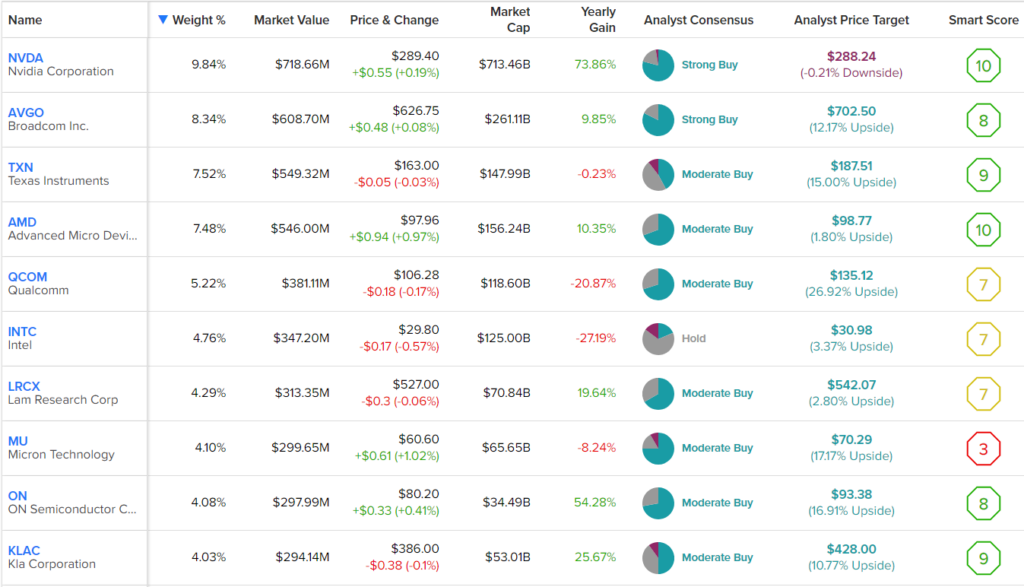
SOXX’s Top 10 Holdings
SMH’s Top 10 Holdings
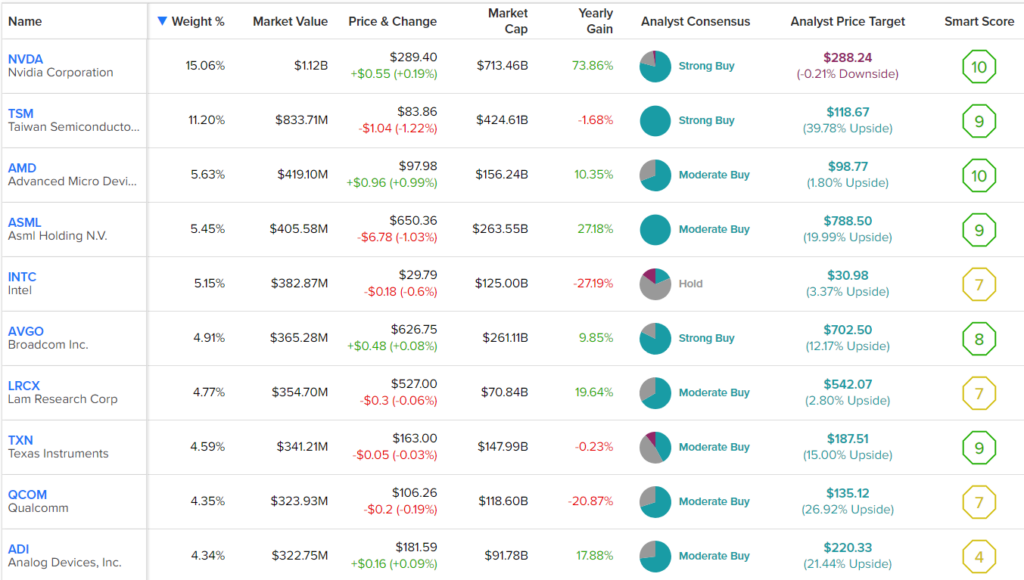
Within this universe, SOXX is a bit more diversified than SMH. While SOXX holds 31 positions, SMH holds just 26. Furthermore, SOXX’s top 10 holdings account for 59.7% of assets, making it top-heavy. However, SMH’s top 10 holdings make up an even higher 65.5% of assets.
One thing you’ll notice is that each ETF’s holdings collectively boast a lot of strong Smart Scores. The Smart Score is TipRanks’ proprietary quantitative stock scoring system that evaluates stocks on eight different market factors. The result is data-driven and does not require any human intervention. A Smart Score of 8 or above is the equivalent of an Outperform rating.
As you can see, the top 10 holdings for both ETFs each feature seven stocks with Smart Scores of 10 or better, headlined by Nvidia (NASDAQ:NVDA), which has a ‘Perfect 10’ score and is the biggest position in each fund.
As you can see, SMH has a larger weighting towards Nvidia at 15.1% (versus 9.8% for SOXX), and it has a larger weighting towards its top few holdings in general. One key difference here is that SMH has a large 10.4% weighting in ASML Holding (NASDAQ:ASML), while ASML has a smaller 3.7% weighting in SOXX. SMH also has a much larger position in Taiwan Semiconductor (NYSE:TSM), with an 11.3% weighting compared to just 3.5% for SOXX.
In turn, SOXX holds several smaller positions in names that you won’t find in SMH’s portfolio, including Lattice Semiconductor (NASDAQ:LSCC), which features a 10 out of 10 Smart Score.
While the overall holdings are similar, I like SOXX’s approach better, as the outsized weightings toward ASML, Taiwan Semiconductor, and especially Nvidia give SMH quite a bit of exposure to just a handful of stocks. This could lead to more downside volatility if one of these individual stocks struggles. Nvidia has been a great stock over the years, but a position of nearly 10% in it, like SOXX has, seems sufficient; 15% seems a bit overboard.
Because of the slight differences in holdings, the two ETFs also feature slightly different valuations. The average P/E multiple for SOXX’s holdings is 20.6, while SMH is slightly higher at 22.8. As is the case with diversification, this isn’t a huge difference, but it still marginally adds to SOXX’s edge. Note that both of these average valuations are slight discounts to the average valuation for the S&P 500 (SPX), which is currently valued at 23.9 times earnings.
Dividends
One other item to note is that while it’s not by a significant amount, SOXX also features a slightly better dividend yield than SMH, with a yield of 1.1% versus 1.0% for SMH. SOXX also has a longer track record as a dividend payer, with 13 consecutive years of payouts versus eight for SMH. Both ETFs have grown their dividend payout for two years in a row. To be clear, with yields around 1%, the dividend isn’t one of the core reasons to invest in either of these ETFs, but it is an added bonus.
Comparing Their Performances
Both of these ETFs have been strong performers over the years. Over the past three years, SOXX has posted a phenomenal annualized total return of 30.8% (as of the end of the most recent quarter). Over the same time frame, SMH has returned an annualized 23.8%, which is impressive, but not quite on the same level as SOXX.
Over a longer time horizon, the returns are fairly similar — the 21.2% annualized five-year total return for SOXX is slightly lower than SMH’s 21.9% five-year return, while SOXX beats SMH over the past decade with an annualized return of 23.9% versus SMH’s 22.5%.
The Winner is…SOXX
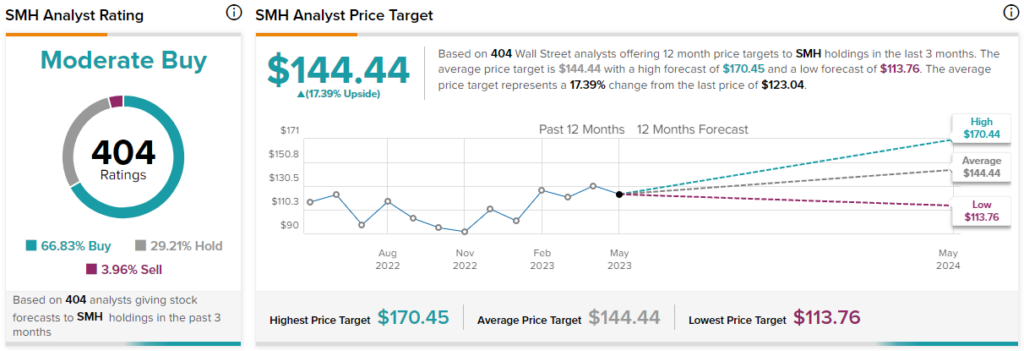
These are both great ETFs. Both have provided investors with good returns over the years, and both harbor plenty of long-term upside. Analysts view both SOXX and SMH as Moderate Buys right now. The average SOXX stock forecast calls for 16.4% upside potential , slightly lower compared to the average SMH stock forecast calling for 17.4% upside potential.
SOXX Price Target

SMH Price Target
They are very similar in many ways, from their identical expense ratios to their similar dividend yields, Smart Scores, analyst projections, and even assets under management.
Where they differ is that SOXX is more diversified in terms of total holdings and is less top-heavy than SMH, which is much more concentrated in its top few positions (especially Nvidia), so I have to give SOXX the edge here.
Furthermore, SOXX’s better performance in recent years and over the past decade adds to its lead over SMH. While both ETFs will likely trade largely in tandem, and I think that most investors will be happy with either ETF given the long-term trajectory of worldwide semiconductor demand, SOXX looks like the winner by a narrow but real margin based on these factors.