


The Invesco QQQ Trust (NASDAQ:QQQ) and the Technology Select Sector SPDR Fund (NYSEARCA:XLK) are two of the biggest and best-known technology ETFs out there. They’ve also been two of the market’s best ETFs to own over the past decade. With the tech sector surging in 2023, both have posted excellent total returns in 2023 so far, with QQQ up 40.8% and XLK up 41.3%. So, what’s the difference between these top tech ETFs, and is one better than the other?
Meet Your ETF AI Analyst
- Discover how TipRanks' ETF AI Analyst can help you make smarter investment decisions
- Explore ETFs TipRanks' users love and see what insights the ETF AI Analyst reveals about the ones you follow.
What are QQQ and XLK’s Strategies?
While these are both tech-centric ETFs, their investment universes are somewhat different. QQQ invests in the Nasdaq 100 Index, the largest 100 non-financial stocks in the Nasdaq (NDX). Meanwhile, XLK invests in the technology sector of the S&P 500 (SPX).
Below, we’ll discuss how this plays out in each fund’s holdings.
Comparison of Portfolios
QQQ owns 101 stocks, and its top 10 holdings make up 48.4% of the index. Below, you’ll find an overview of QQQ’s top 10 holdings using TipRanks’ holdings tool.
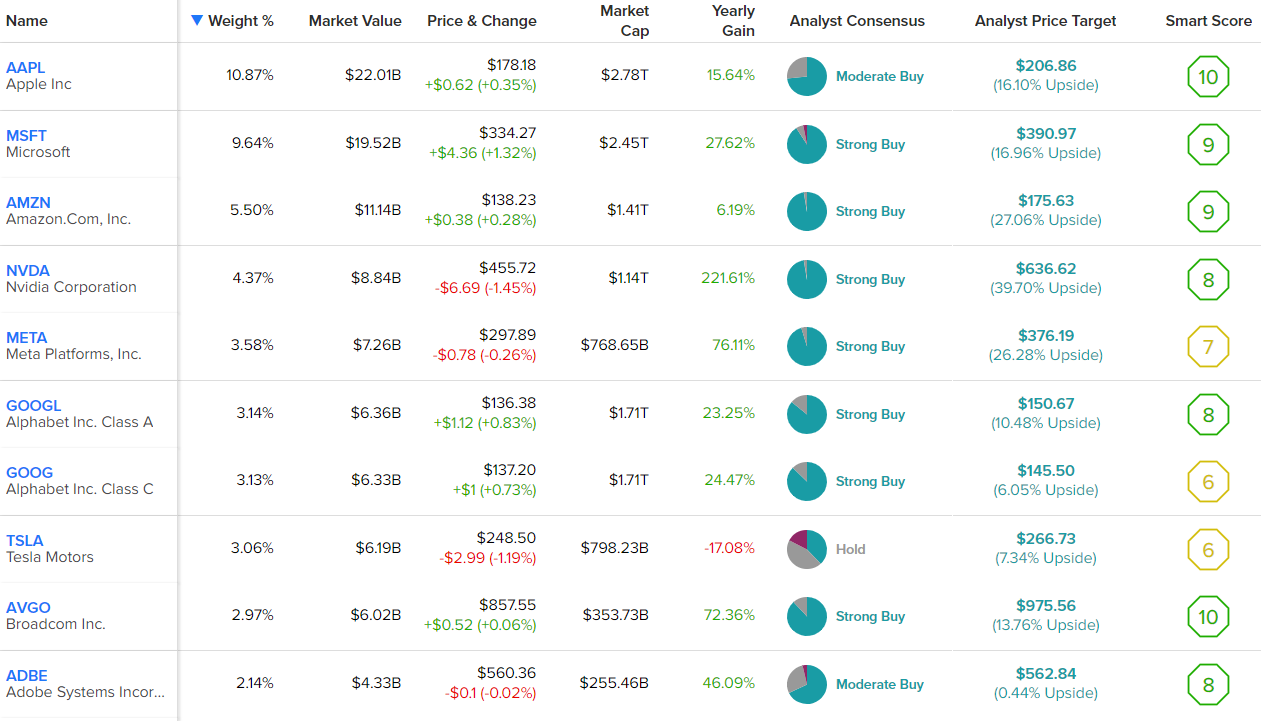
As you can see, QQQ gives investors exposure to the market’s top mega-cap tech stocks like Apple (NASDAQ:AAPL), Microsoft (NASDAQ:MSFT), Amazon (NASDAQ:AMZN), Nvidia (NASDAQ:NVDA), Meta Platforms (NASDAQ:META), Alphabet (NASDAQ:GOOG) (NASDAQ:GOOGL), and Tesla (NASDAQ:TSLA).
It’s also important to note that while the Nasdaq is a technology-heavy index, there are also plenty of non-technology companies that comprise the index, and several of these companies can be found just outside of QQQ’s top holdings.
For example, Costco (NASDAQ:COST) and Pepsi (NASDAQ:PEP) are the fund’s 11th- and 12th-largest holdings, with weightings of approximately 2% each. This isn’t a bad thing, as these stocks have been phenomenal performers for years, but investors should simply be aware that there are some non-tech stocks here, even though “the Q’s” have become synonymous with technology for many investors.
XLK is slightly different. It focuses specifically on the technology sector of the S&P 500, so there are no non-tech stocks within its holdings. It’s also a bit more concentrated than QQQ — it owns 65 stocks, and its top 10 holdings make up 69.2% of the fund. Below, you’ll find an overview of XLK’s top 10 holdings.

As you can see, XLK has large positions in some of the same mega-cap tech stocks that QQQ owns, like its massive positions in Microsoft and Apple, which each have weightings of around 22% in the fund. However, look closely, and you’ll notice that many of the other mega-cap tech stocks that QQQ owns aren’t present here in the top 10, or at all, because XLK doesn’t own them.
Why not? Because the S&P index categorizes these stocks differently and does not include them within the technology sector. For example, Amazon and Tesla are classified as consumer discretionary companies, and they make up the largest positions for the Consumer Discretionary Select Sector SPDR Fund (NYSEARCA:XLY). Meta Platforms and Alphabet are considered communications services and can be found in the Communications Services Select Sector SPDR Fund (NYSEARCA:XLC).
With these tech behemoths not included in XLK, the fund has room for other large-cap tech stocks in its top 10 holdings, such as Adobe (NASDAQ:ADBE), Salesforce (NYSE:CRM) and Oracle (NYSE:ORCL).
One approach isn’t necessarily better than the other, but QQQ probably gives investors a larger and more comprehensive range of exposure to what many investors think of as ‘technology stocks’ (even though it also includes some non-tech stocks like Pepsi and Costco). XLK has a more narrow definition of tech stocks. It doesn’t include any non-tech stocks, but it’s also missing some of the household names that investors think of when they think of tech stocks. Ultimately, this is the key difference between these two ETFs.
Both strategies yield portfolios with strong Smart Scores. The Smart Score is a proprietary quantitative stock scoring system created by TipRanks. It gives stocks a score from 1 to 10 based on eight market key factors. A score of 8 or above is equivalent to an Outperform rating. Seven of QQQ’s top 10 holdings feature Smart Scores of 8 or above, while eight of XLK’s top 10 holdings score 8 or better. Nevertheless, QQQ and XLK both have ETF Smart Scores of 8 out of 10.
How Have QQQ and XLK Performed in the Long Term?
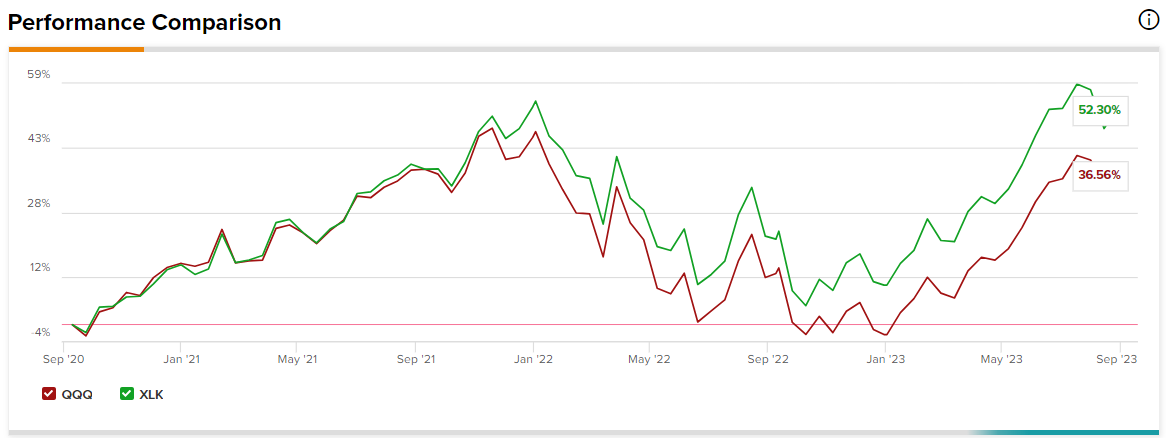
Both ETFs have posted dazzling returns over the long term. As discussed above, both ETFs have returned over 40% in 2023 (as of the end of August). Over the past three years, QQQ’s annualized total return has been 9.3%. It has returned 16.0% over the past five years on an annualized basis and 18.6% over the past 10 years on an annualized basis.
XLK has outperformed QQQ on a three-year basis, with a three-year annualized return of 13.4%. It has also beaten QQQ over the past five years, with an annualized return of 19.6%. Even over the past 10 years, it edges QQQ out with an excellent 20.5% annualized return.
Both ETFs have been top performers and have given their investors tremendous gains over the years, but XLK has outpaced QQQ over each of these time frames.
Expenses
These are both very reasonably-priced ETFs. QQQ sports an expense ratio of 0.20%, while XLK is even cheaper at 0.10%. This means that an individual putting $10,000 into QQQ would pay $20 in fees during their first year of investing in the fund, while an individual allocating $10,000 into XLK would pay just $10 in fees.
These are both favorable expense ratios for investors, but over the long run, the XLK investor would save a bit more money. Assuming that each fund returns 5% per year going forward and that the expense ratios stay where they are now, the QQQ investor would pay $255 in fees, while the XLK investor would pay $128 over the course of the decade.
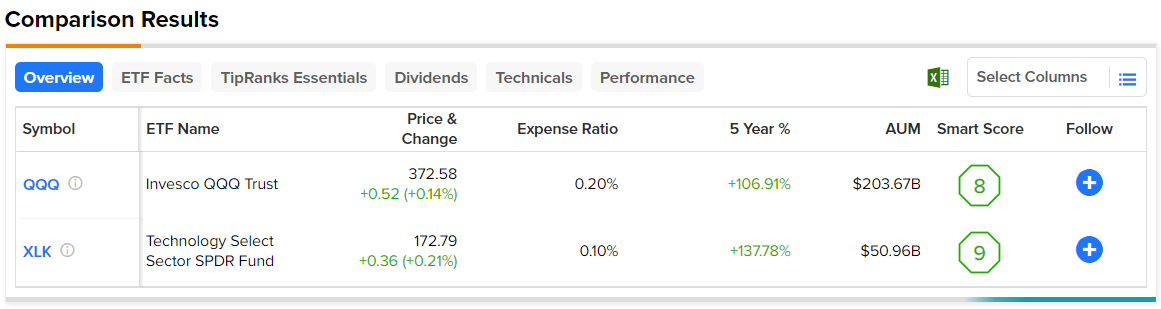
Below, you’ll find a comparison of QQQ and XLK using TipRanks’ ETF Comparison Tool, which enables investors to compare up to 20 ETFs at a time on factors like fees, performance, and more.
Is QQQ Stock a Buy, According to Analysts?
Turning to Wall Street, QQQ earns a Moderate Buy consensus rating based on 84 Buys, 18 Holds, and no Sell ratings assigned in the past three months. The average QQQ stock price target of $432.87 implies 14.8% upside potential.

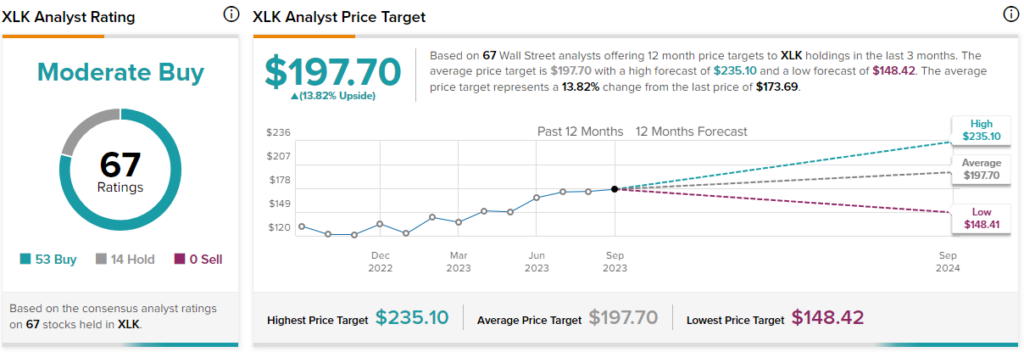
Is XLK Stock a Buy, According to Analysts?
Turning to Wall Street, XLK earns a Moderate Buy consensus rating based on 53 Buys, 14 Holds, and no Sell ratings assigned in the past three months. The average XLK stock price target of $197.70 implies 13.8% upside potential.
Investor Takeaway
These are both top tech ETFs. XLK has slightly outperformed QQQ over the past 10 years and also offers investors a lower expense ratio. Additionally, it offers an exclusive focus on technology stocks. However, I also like QQQ’s more all-encompassing group of technology holdings, which gives investors exposure to leading tech stocks like Meta Platforms, Amazon, and Alphabet, which aren’t found in XLK.
Both approaches have been fruitful over the years, and I find it hard to go wrong with either of these ETFs, and they both continue to look attractive over the long term.