


The Invesco Dynamic Multifactor ETF (BATS:OMFL) is a differentiated ETF with a strong track record plus a “Perfect 10” Smart Score from TipRanks’ proprietary quantitative scoring system. While OMFL underperformed the broader market in 2023, I’m willing to bet that it will return to winning ways, given that it outperformed the broader market during the four prior years.
Elevate Your Investing Strategy:
- Take advantage of TipRanks Premium at 50% off! Unlock powerful investing tools, advanced data, and expert analyst insights to help you invest with confidence.
I’m bullish on this popular $6.3 billion ETF from Invesco based on its solid track record, reasonable expense ratio, diversified portfolio, attractive valuation, and perfect Smart Score.
What Is the OMFL ETF’s Strategy?
According to OMFL’s sponsor, Invesco, OMFL “is based on the Russell 1000 Invesco Dynamic Multifactor Index.” The Russell 1000 is an index that measures the performance of 1,000 of the largest stocks in the United States. OMFL will invest at least 80% of its assets in this index. The stocks within the index are “assigned a multi-factor score from one of five investment styles: value, momentum, quality, low volatility, and size.”
Depending on what part of the economic cycle the index provider believes we are in (recovery, expansion, slowdown, or contraction), the managers will emphasize the selection of stocks that score highly based on two to three of these factors. This assessment is based on economic and monetary indicators such as manufacturing business surveys, labor market conditions, monetary conditions, and consumer sentiment surveys.
This is meant to favor factor configurations that have “historically outperformed other factors in certain stages of the economic cycle.”
Invesco makes a decision on what stage of the economic cycle we are in on a monthly basis, and the factors are applied accordingly.
Essentially, OMFL takes the stocks within the Russell 1000 and tilts its selections toward stocks that exhibit the attributes it sees as most favorable during the current economic cycle in order to optimize its portfolio.
Strong Overall Track Record
This intensive approach has led to solid results since OMFL’s launch. While OMFL’s annualized three-year return of 5.3% (as of April 30) is fairly underwhelming, its annualized five-year return of 13.7% (as of the same date) is a lot better, and so is its 13.6% annualized return since its inception (2017).
OMFL has underperformed the S&P 500 (SPX), as represented by the Vanguard S&P 500 (NYSEARCA:VOO), over the three-year time horizon (where VOO has returned 8.0% on an annualized basis). But it slightly outperformed it over the five-year time frame (where VOO has returned 13.2% on an annualized basis).
With the exception of 2022, when the entire market was in the grips of a downturn, OMFL has produced some excellent results on a yearly basis in recent years.
In 2019, OMFL knocked it out of the park with an exceptional 35.6% total return, outperforming VOO, which had a nice 31.4% return of its own. OMFL followed this up with a 21.0% return in 2020, slightly outperforming VOO’s 18.3% gain. In 2021, OMFL returned an excellent 29.0%, narrowly beating VOO’s 28.8% return.
Then, the fund lost 14.0% during the 2022 bear market, while VOO fell further, with an 18.2% loss for the year. Last year, OMFL bounced back with a 21.5% return, although it wasn’t able to keep up with VOO’s 26.3% increase during the rampant 2023 bull market.
So, while OMFL has underperformed the broader market on an annualized three-year basis and underperformed the market in 2023, it outperformed it during the four years prior to that and held up better during 2022’s bear market. Therefore, I am willing to give the fund a mulligan for 2023 and bet that it will return to winning ways.
Diversified and Inexpensive Portfolio
With positions in 376 stocks, OMFL is quite diversified, and with just 8.7% of the fund’s assets allocated to its top 10 holdings, concentration risk isn’t a concern here. Top holding Western Digital (NASDAQ:WDC) has a weighting of just 1.0%.
You can take a look at OMFL’s top 10 holdings using the table below from TipRanks’ holdings tool.

Looking at OMFL’s current portfolio, it appears that the fund is taking on more of a value tilt at the moment. It includes homebuilders, energy stocks, financials, airlines, and legacy tech companies in its top 10 holdings at the expense of the magnificent seven or other big tech stocks, which are more growth-oriented and have higher valuations.
The numbers back this up. The price-to-earnings ratio of OMFL’s holdings is an attractive 13.4x. This is significantly lower than the valuation of the S&P 500, which currently trades at 23.2x earnings.
This inexpensive valuation makes OMFL attractive and should give it more of a margin of safety and downside protection than the broader market.
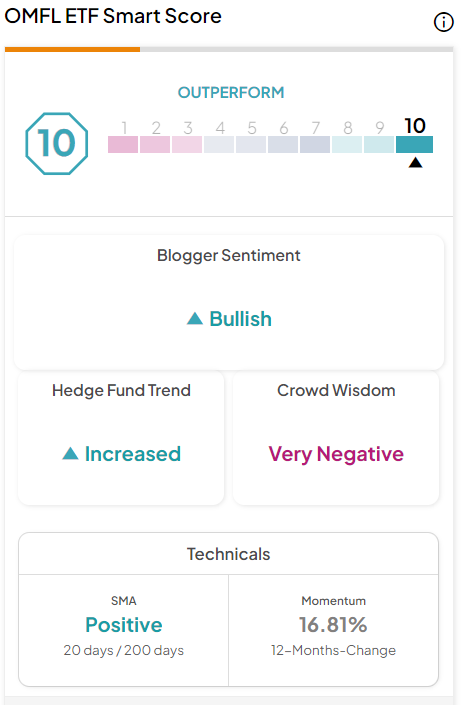
Six of OMFL’s top 10 holdings feature Outperform-equivalent Smart Scores. The Smart Score is a proprietary quantitative stock scoring system created by TipRanks. It gives stocks a score from 1 to 10 based on eight market key factors. A score of 8 or above is equivalent to an Outperform rating. The score is data-driven and does not involve any human intervention.
OMFL itself features a 10 out of 10 ETF Smart Score, placing it in good company among other strong ETFs to receive this venerable rating.
Reasonable Expense Ratio
OMFL charges a relatively reasonable expense ratio of 0.29%. While it isn’t as cheap as those of some of the mega-cap index funds out there, it is still just about half the average expense ratio for all ETFs (0.57%). It’s also worth pointing out that this isn’t a bad expense ratio for an ETF that runs a more complex strategy and has more turnover.
This 0.29% expense ratio means that an investor in the fund will pay $29 in fees on a $10,000 investment annually. Assuming the fund returns 5% per year going forward, this investor will pay $368 in fees over a 10-year time horizon.
Is OMFL Stock a Buy, According to Analysts?
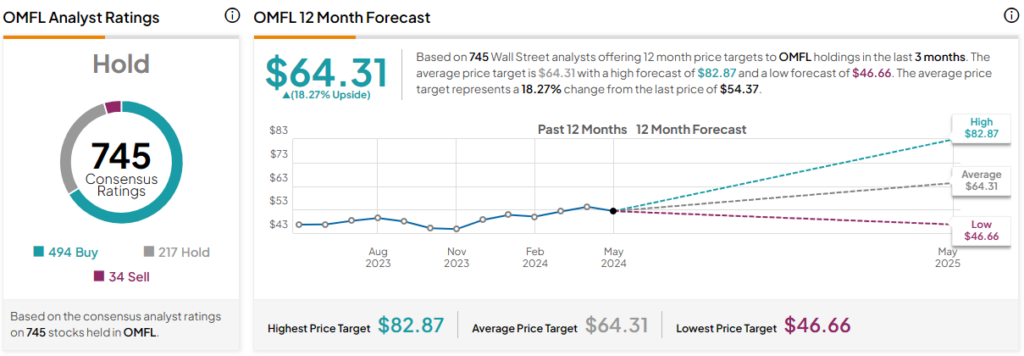
Turning to Wall Street, OMFL earns a Hold consensus rating based on 494 Buys, 217 Holds, and 34 Sell ratings assigned in the past three months. The average OMFL stock price target of $64.31 implies 18.3% upside potential.
The Takeaway: A Solid Choice
I’m bullish on the OMFL ETF based on its diversified portfolio and the attractive valuations of the stocks within it. I’m also bullish on OMFL because it is one of the few ETFs to earn a 10 out of 10 Smart Score from TipRanks’ proprietary rating system.
The ETF also has a reasonable expense ratio for a fund running an intricate strategy. While it lagged the market in 2023 and currently lags it on a three-year annualized basis, it has a strong overall track record. It has slightly outperformed the broader market over the past five years and produced an admirable double-digit annualized return since its inception.