


With a massive 11.3% dividend yield, the Global X NASDAQ 100 Covered Call ETF (NASDAQ:QYLD) immediately catches the eye as a tempting option for dividend investors. Even better, it pays out its dividend on a monthly basis. There is certainly a lot to like about this ETF for income investors. However, before investors get too excited about QYLD, there are a few other factors that they would be wise to consider as well.
Meet Your ETF AI Analyst
- Discover how TipRanks' ETF AI Analyst can help you make smarter investment decisions
- Explore ETFs TipRanks' users love and see what insights the ETF AI Analyst reveals about the ones you follow.
What is QYLD’s Strategy?
QYLD is an $8.25 billion ETF from Global X that was launched in December 2013. According to Global X, QYLD “follows a ‘covered call’ or ‘buy-write’ strategy, in which the Fund buys the stocks in the Nasdaq 100 Index and ‘writes’ or ‘sells’ corresponding call options on the same index.”
In other words, QYLD owns the mega-cap and large-cap growth stocks that populate the Nasdaq 100 (NDX), and it generates income for investors and achieves its outsized dividend yield by selling covered calls against these holdings.
QYLD’s Holdings
QYLD’s underlying index is the Nasdaq 100, so the fund is made up of many of the mega-cap tech stocks and large-cap growth stocks that investors know and love. The fund is fairly diversified, holding 102 stocks. Its top 10 holdings account for just under half of its assets. See below for an overview of QYLD’s top holdings from TipRanks’ holdings screen.
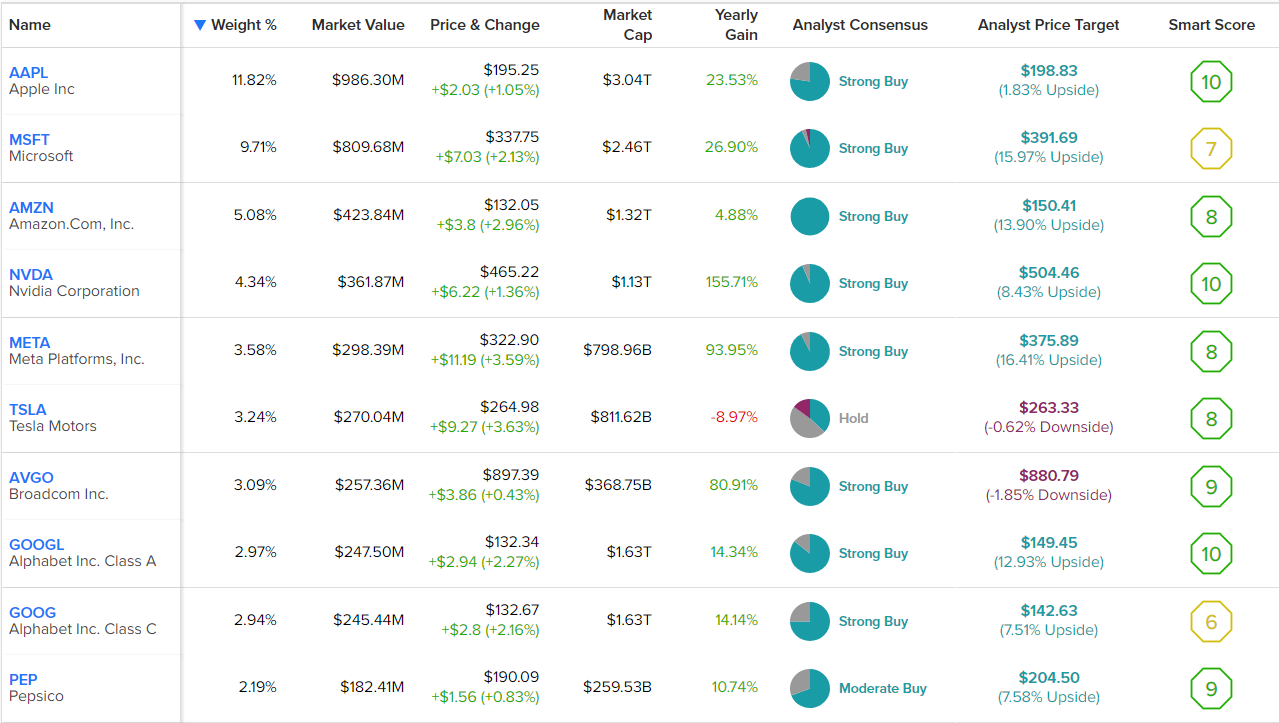
As you can see above, QYLD’s top holdings skew heavily towards the “magnificent seven” stocks that have led the market higher in 2023 — Apple (NASDAQ:AAPL), Microsoft (NASDAQ:MSFT), Amazon (NASDAQ:AMZN), Nvidia (NASDAQ:NVDA), Meta Platforms (NASDAQ:META), Tesla (NASDAQ:TSLA), and Alphabet (NASDAQ:GOOG) (NASDAQ:GOOGL).
It’s hard to argue with this portfolio of blue-chip tech and growth stocks, and TipRanks’ Smart Score system agrees, assigning eight of QYLD’s top 10 holdings outperform-equivalent Smart Scores. The Smart Score is a proprietary quantitative stock scoring system created by TipRanks. It gives stocks a score from 1 to 10 based on eight market key factors. A score of 8 or above is equivalent to an Outperform rating.
QYLD features an Outperform-equivalent ETF Smart Score of 8.

Is QYLD Stock a Buy, According to Analysts?
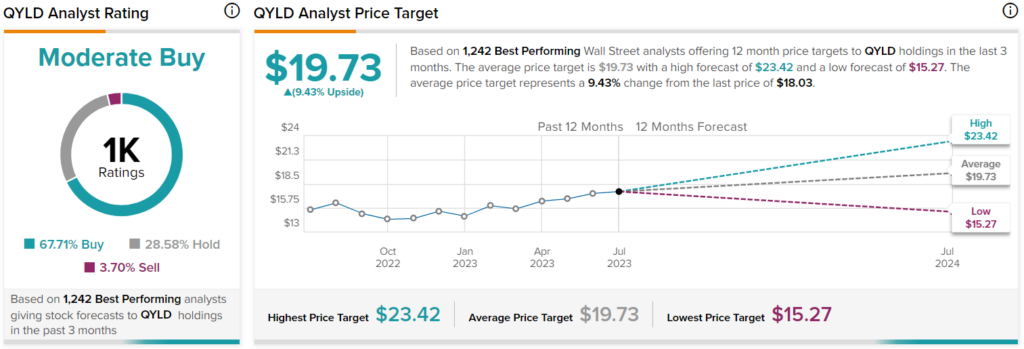
Turning to Wall Street, QYLD has a Moderate Buy consensus rating, as 67.71% of analyst ratings are Buys, 28.58% are Holds, and 3.70% are Sells. At $19.73, the average QYLD stock price target implies 9.4% upside potential.
QYLD’s Long-Term Performance
To see how QYLD has performed over time, we can look at it over the years from a total-return perspective, which captures both price appreciation and returns from dividends. As of the end of the most recent quarter in June, QYLD has a one-year total return of 14.6%. Meanwhile, it has a three-year annualized return of 6.9% and a five-year annualized return of 5.7%.
Keep in mind that these returns include what investors gain from the large dividend payouts, so they suddenly look a lot less exciting. Since its inception at the end of 2013, QYLD has returned a slightly better 7.2% on an annualized basis.
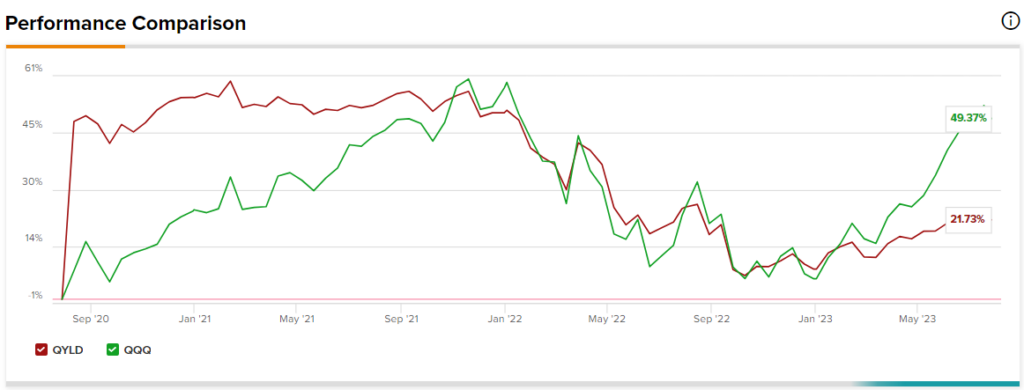
While these returns are positive, they are somewhat lackluster, especially when compared to just investing in the Nasdaq 100, which the fund uses as its underlying index. Investors can do just that with an ETF like the Invesco QQQ Trust (NASDAQ:QQQ), which invests in the plain vanilla Nasdaq 100 without a complex strategy of selling covered calls like QYLD.
Over the past year, QQQ has had a one-year return of 32.8%, more than double that of QYLD. QQQ’s three-year annualized return is also far superior to that of QYLD at 15%. On a five-year basis, QQQ again easily surpasses the total return of QYLD with a far better 17.9% annualized return, more than tripling QYLD’s return. Finally, over a 10-year timeframe, QQQ investors have made a stellar 18.9% on an annualized basis.
So, while QYLD looks tempting with its 11.3% dividend yield, investors would have been far better off simply investing in QQQ over the years, which has vastly outperformed QYLD, even when this yield is taken into account.
The dividend yield is nice to have, but QQQ investors have grown their wealth to a far higher level than QYLD investors. Because QYLD sells covered calls against its positions (a strategy that caps upside while slightly reducing downside), it leaves upside on the table as these holdings get called away if the covered call gets hit. You can see it playing out in real time this year, as the Nasdaq has surged, which is why QQQ has more than doubled QYLD’s year-to-date total return.
Fees & Expenses
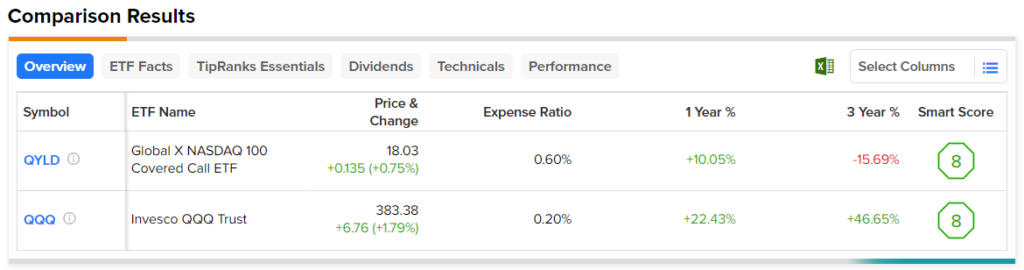
There’s also the matter of fees — with an expense ratio of 0.60%, QYLD investors are paying a fairly high $60 on a $10,000 investment. This is higher than QQQ, where investors pay a lower 0.20%, which comes out to $20 on a $10,000 investment.
This disparity becomes more pronounced over time — if the fees remain consistent over time and both funds return 5% per year, after a decade, the QYLD investor would pay $750 in fees, while the QQQ investor would only pay $255 over the same time frame.
Below, you can take a look at a comparison of QYLD and QQQ created with TipRanks’ customizable ETF Comparison tool, which allows investors to compare up to 20 ETFs at a time across a variety of inputs.
The Takeaway
The idea of being able to combine these blue-chip tech stocks with an 11.3% dividend yield certainly has its appeal. Receiving dividend payments on a monthly basis is also appealing, and QYLD deserves credit for its rock-solid track record of paying out a monthly dividend every month for nine years and counting, so I can certainly understand why some investors like QYLD.
However, as the comparison to QQQ shows, QYLD’s strategy can leave a lot of upside on the table, and investors historically would have been far better off investing in a simple Nasdaq 100 fund like QQQ. QQQ is clearly the superior investment choice in this comparison, and it’s the ETF I would choose to invest in.
Nonetheless, if an investor understands QQQ’s superior value proposition and still wants the monthly income that QYLD offers, they could consider initiating a position in QQQ and a smaller position in QYLD in order to get the monthly dividend payments.